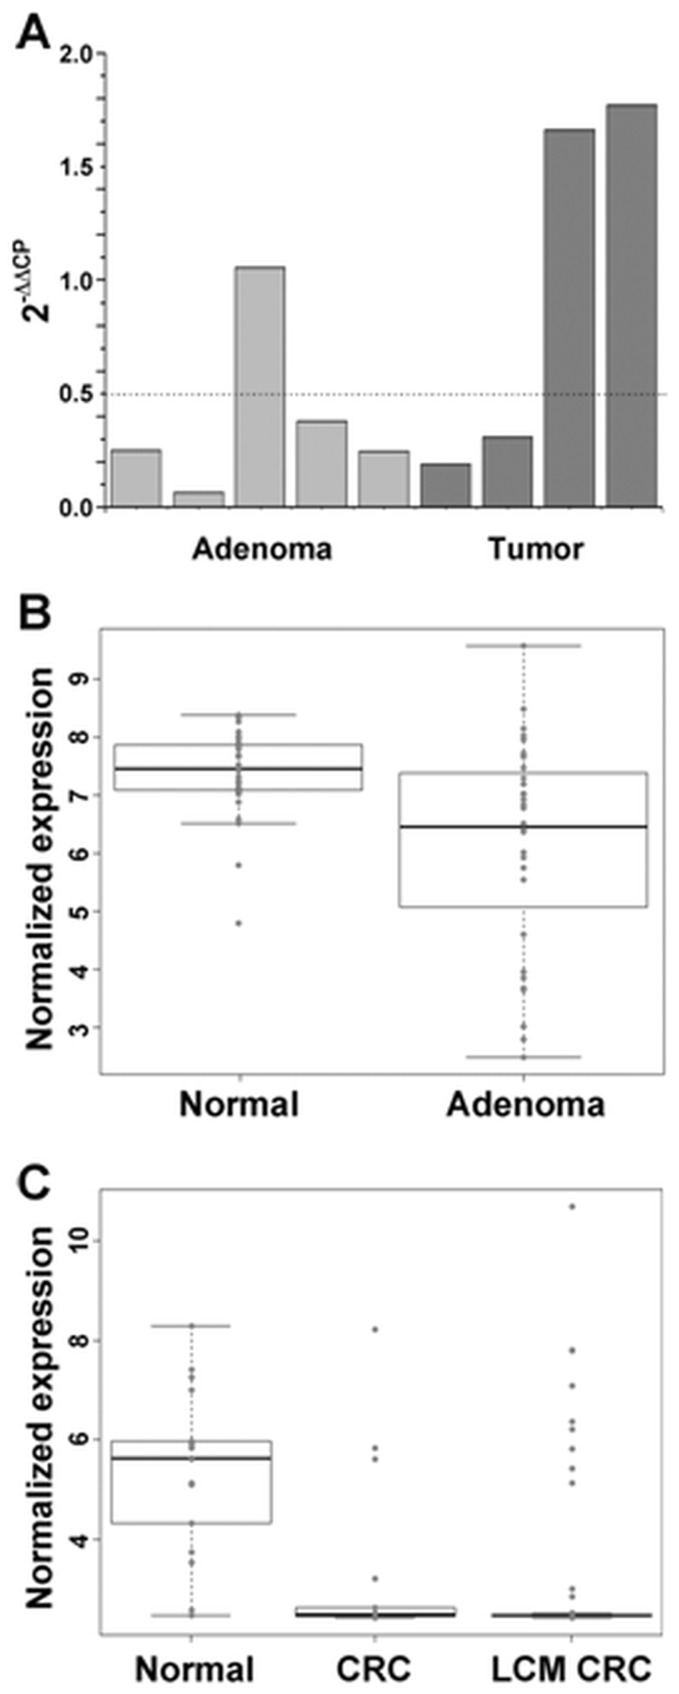
Figure 4. Heterogeneity of PTGDR mRNA expression levels in laser microdissected adenoma and tumor samples.
Real-time PCR and data analysis was carried out as described in Materials and Methods. Genes were considered to be downregulated with  values lower than 0.5 (50% decrease, horizontal dotted line) (A) Expression value distribution of the 215894_at probeset (for PTGDR gene) in the GSE8671 (B) and GSE18105 (C) GEO data sets. P values: Normal vs. Adenoma P = 0.000712; CRC vs. Normal P = 0.0003797; LCM CRC vs. Normal P = 0.0000004; LCM CRC vs. CRC P = 0.834.

