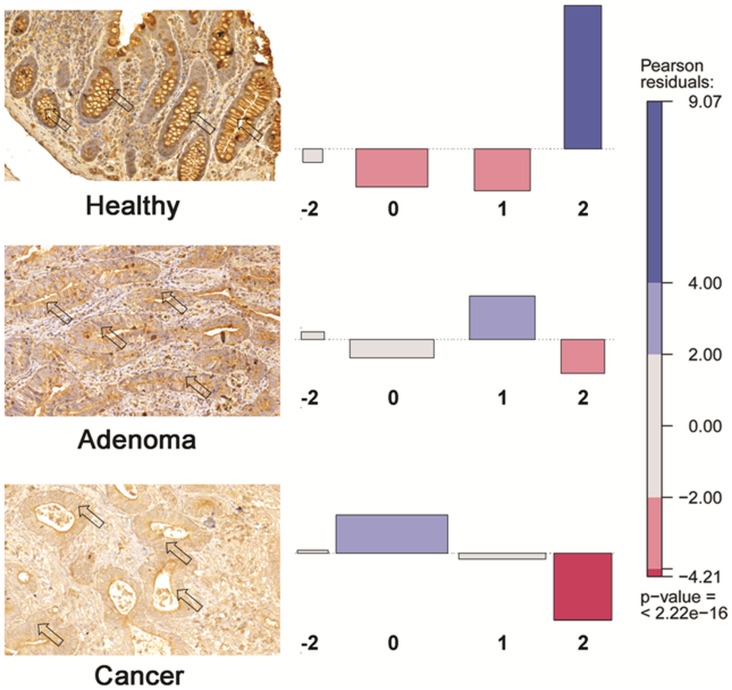
Figure 6. Immunhistochemical staining (20× magnification) of the prostaglandin D2 receptor (PTGDR) protein (left panel) on normal colon (top), adenoma (middle) and tumorous (bottom) colonic tissues illustrating the progressive decrease of the intraepithelial PTGDR protein expression (arrows) in the adenoma-carcinoma sequence.
In the normal samples (top), predominantly strong, diffuse cytoplasmic staining was detected, which moderately decreased in the adenoma samples (middle), and only weak cytoplasmic staining was observed in the colorectal cancer samples (bottom). The right panel shows the association plots which represent tendentiously decreasing PTGDR protein expression along the adenoma carcinoma sequence. To measure the association of two variables (expression and disease stage), the Chi-square test was used. The height (and color depth) of the boxes is proportional to the difference between the observed and expected frequency of scores. The downward red colored boxes indicate that the observed frequency is lower than expected. The upward, blue items represent the opposite. PTGDR immunostaining scores: −2 = no staining; 0 = weak staining; 1 = moderate staining; 2 = strong diffuse epithelial cytoplasmic immunostaining.

