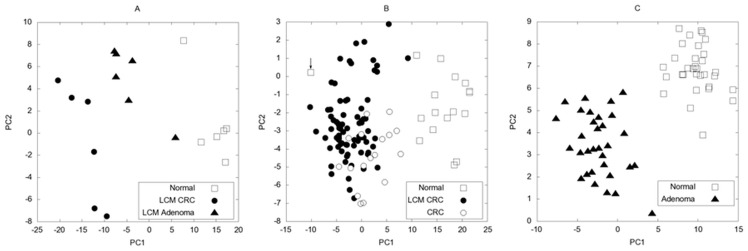
Figure 7. The first 2 principal components (PC) for our LCM (GSE15960) (A), the GSE18105 (B) and GSE8671 sample sets (C).
The principal components were calculated from the log2-expression values of the 154 selected probe sets for the normal-CRC samples in our LCM set, and then all 3 sets were projected into the principal component coordinate space. Note that this method can be considered as an unsupervised classification, since we did not use explicitly the categories in the data analysis process. Figure 7.A shows that PC transformation separates very well the normal and LCM CRC samples and places the adenoma samples between normal and CRC samples. To validate our list of potential marker genes, we transformed the data of two other independent studies into the same PC coordinates. The two studies from the Gene Expression Omnibus microarray archive were GSE18105 with normal, CRC and LCM CRC samples and GSE8671 with normal and adenoma samples. For both sets the separation of the categories is good except for one outlier point in B marked with an arrow (see discussion in text).

