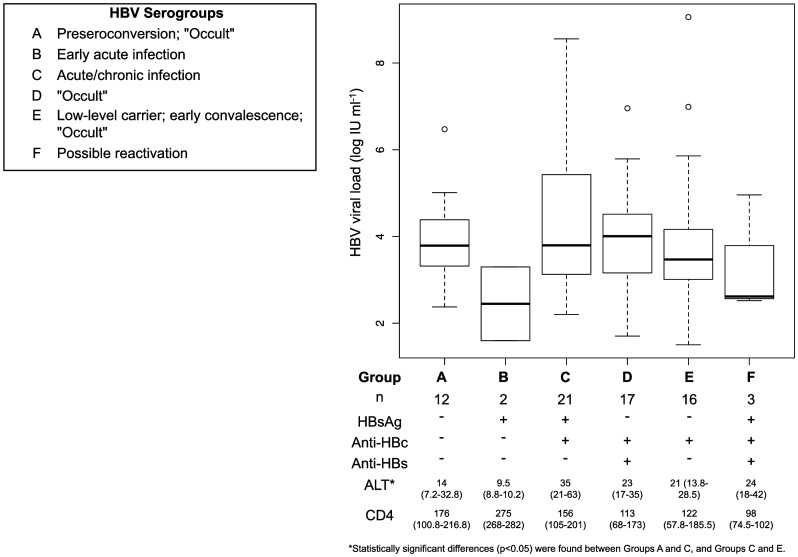
Figure 2. Box and whisker plot of HBV viral loads of the 71 HBV DNA+ve participants separated into the six serological groups (A to F), interpreted according to Hollinger (2008) with modifications [35].
“n” indicates the number of participants in each group. ALT and CD4 cell counts for each group are indicated in the table below the plot as “Median (Interquartile Range)”. Viral loads and CD4 cell counts did not differ significantly between the six serological groups. The five HBeAg+ve participants belonged to serological group C.

