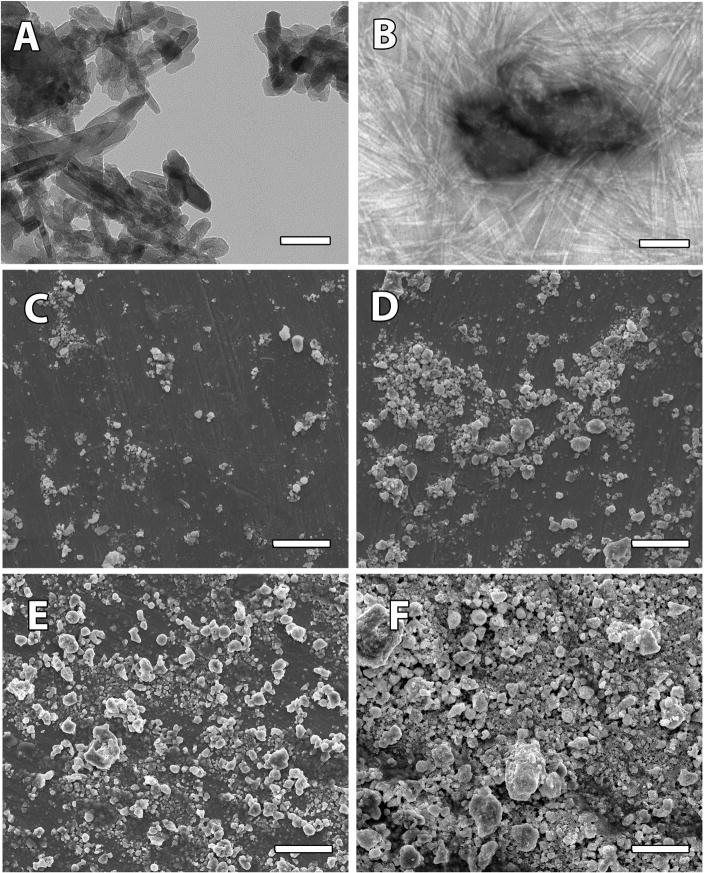
Figure 2. Characterization of nanomatrix composites.
TEM images of (A) HANPs and (B) PA-RGDS (16% HANP) at 42000×. SEM Images of (C) PA-RGDS (16% HANP) (D) PA-RGDS (33% HANP) (E) PA-RGDS (50% HANP) and (F) PA-RGDS (66% HANP) at 1000×. Scale bars represent 100 nm for TEM and 50μm for SEM respectively. Considered together, TEM and SEM images demonstrate aggregates of varying size and distribution made up of HANPs enmeshed within PA nanofibers.

