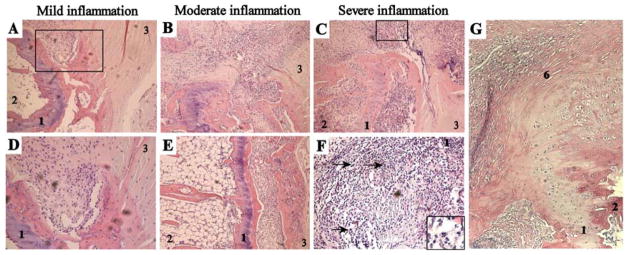
Figure 1. Histological analysis of inflammation in spondylitis.
All photos are from H&E stained paraffin sections of axial joints. A+D, Mild inflammation, with cells infiltrating the connective tissue located at the junction of the bone and the annulus fibrosus. Panel A represents a 100x magnification and picture D is a larger magnification (500x) of the rectangle depicted in picture A. B+E, Moderate inflammation (100x magnification), showing progression of the inflammatory pannus in the bone outside of the cartilage endplate. C+F, Severe inflammation, affecting the connective tissue as well as the bone on both sides of the cartilage endplate. Panel C represents a 100x magnification and picture F is a larger magnification (500x) of the rectangle depicted in picture C. Arrows and the insert in picture F indicate neutrophils. G. Non-inflamed enthesis, next to moderate inflamed connective tissue (100x magnification) 1-cartilage endplate, 2-bone with bone marrow, 3-annulus fibrosus, 6-enthesis.

