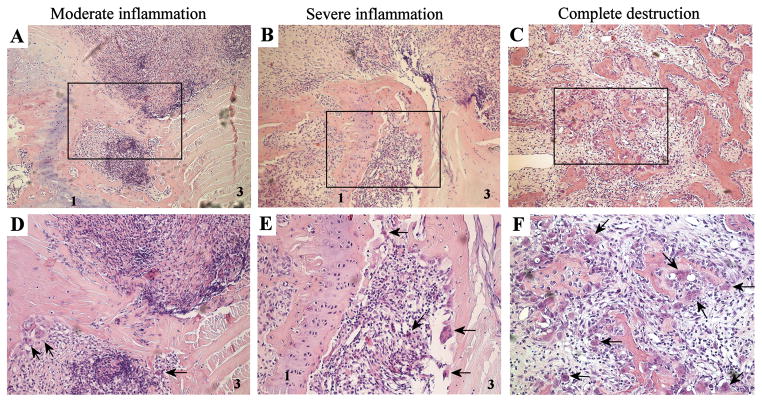
Figure 2. Histological analysis of tissue destruction in spondylitis.
Overview of moderate inflammation (A+D), severe inflammation (B+E) and complete destruction (C+F). Panel A, B and C are 100x magnifications and panel D, E and F represent larger magnifications (500x) of the rectangles within, respectively, panel A, B and C. Arrows point towards multinucleated giant cells at the edge between the inflammatory pannus and the bone. All photographs are H&E stainings. 1-cartilage endplate, 3-annulus fibrosus.

