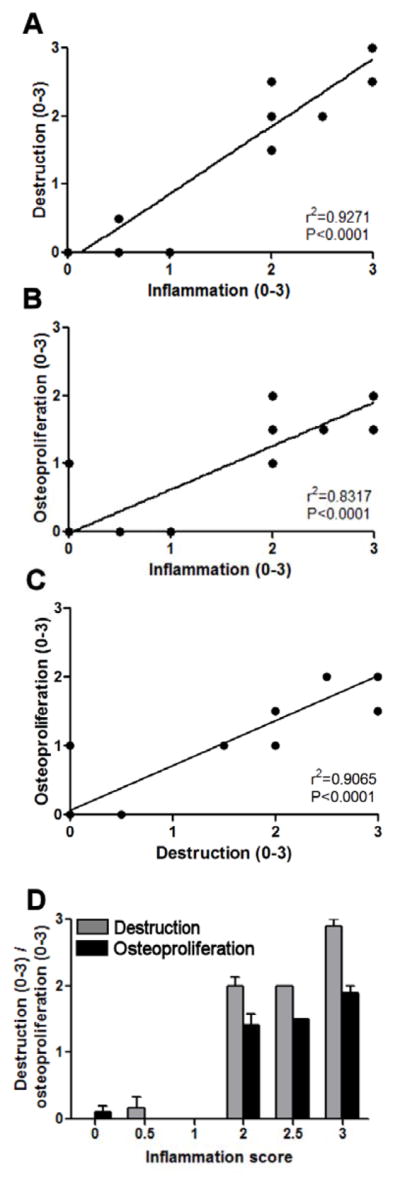
Figure 4. Quantification of inflammation, bone destruction and osteoproliferation.

All three processes were scored using a 0–3 quantitative scoringssystem and every intervertebral disc was scored separately (in total 27 discs). A, Correlation between inflammation and tissue destruction is depicted (r2=0.9271 and P<0.0001). B, Correlation between inflammation and osteoproliferation is depicted (r2=0.8317 and P<0.0001). C, Correlation between destruction and osteoproliferation is depicted (r2=0.9065 and P<0.0001) D, Tissue destruction and osteoproliferation are analyzed compared to the inflammation score. Values depicted are mean and SEM.
