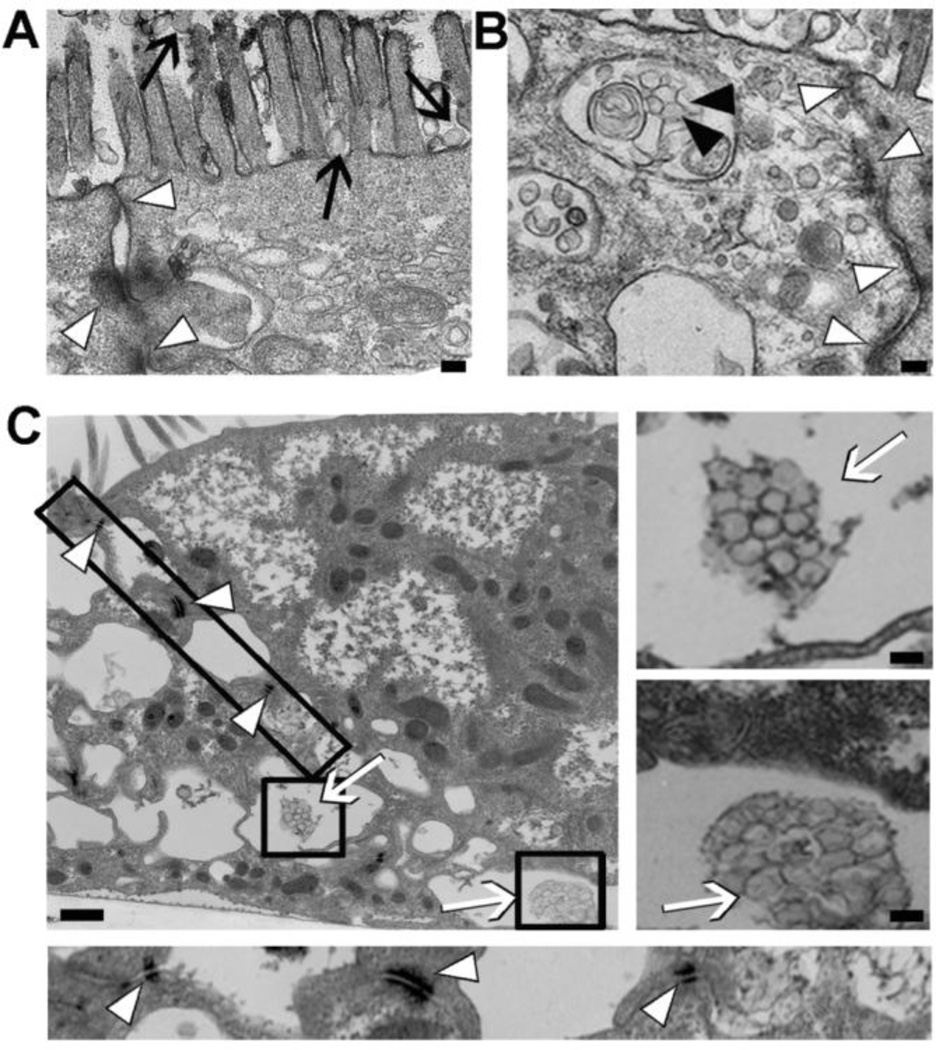
Figure 6. Visualization of transport of anti-ICAM nanocarriers across Caco-2 cells.
Transmission electron micrographs of anti-ICAM NCs incubated for 3-h with non-activated Caco-2 cells. Images show anti-ICAM NCs (A) bound (black arrows), (B) internalized within vesicular compartments (black arrowheads), and (C) transcytosed to the basolateral space between cells (white arrows), with intact cell junctions (white arrowheads). The boxes represent areas further magnified in independent panels. Magnification bar=100-nm.

