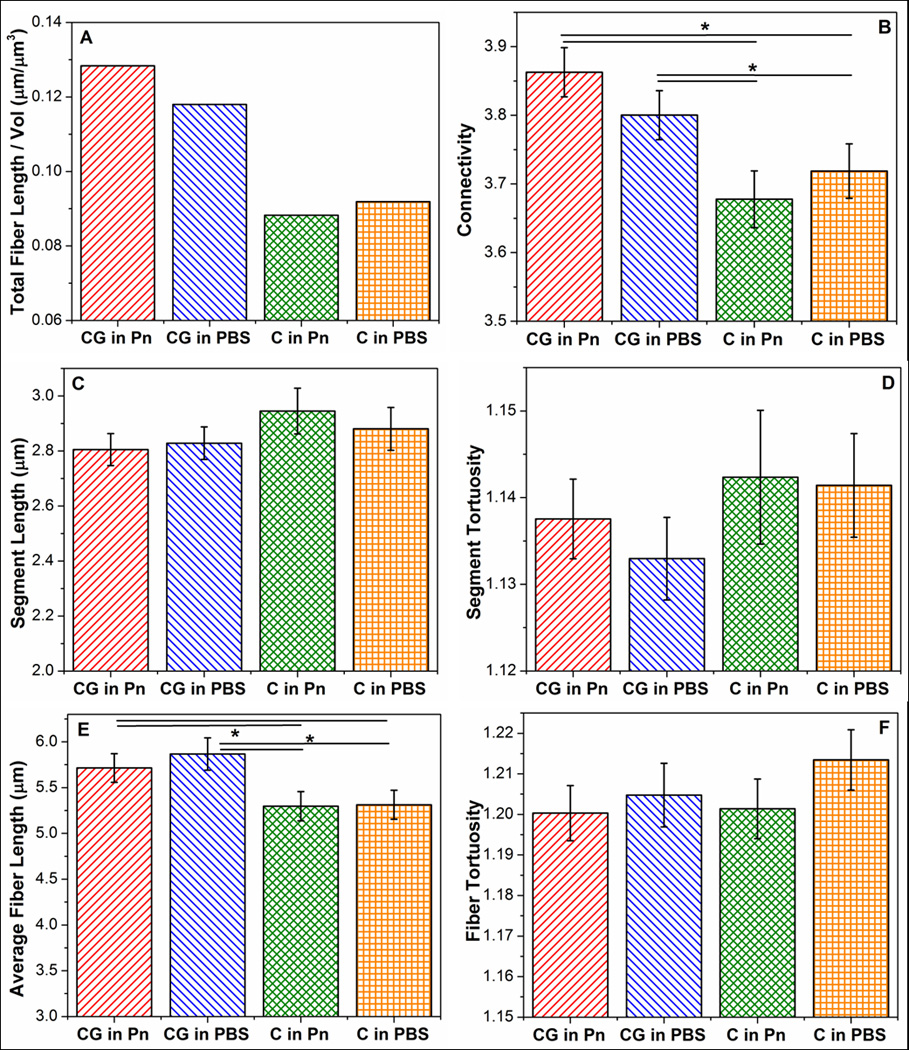
Figure 6.

Comparison of network parameters of (A) total fiber length per volume, (B), connectivity, (C) segment length, (D) segment tortuosity, (E) fiber length, and (F) fiber tortousity between collagen networks obtained under different digestion conditions. Collagen networks obtained from co-gels (CG in PBS, CG in Pn) show high connectivities and longer average fiber lengths. Error bars represent 95% confidence intervals. * represents statistical significance at the 95% level. Note: The y-axes of these plots do not start at “0”.
