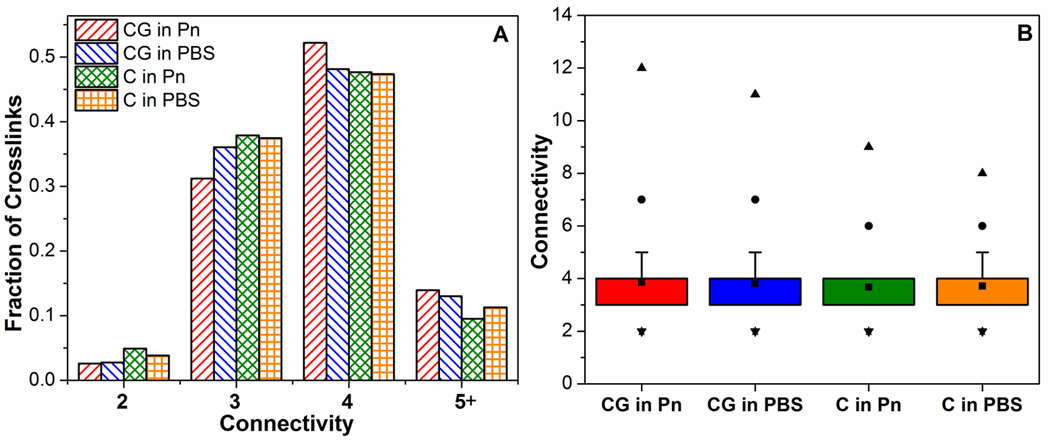
Figure 8.

Comparison of connectivity distributions in collagen networks from different casting and digestion conditions. (A) shows that >80% of cross-links contain connectivities of 3 or 4 in all samples. Box-plot in (B) shows that the collagen networks from co-gels exhibit slightly higher maximum connectivities (▲) and higher connectivities at the 99% level (●).
