
Figure 9.
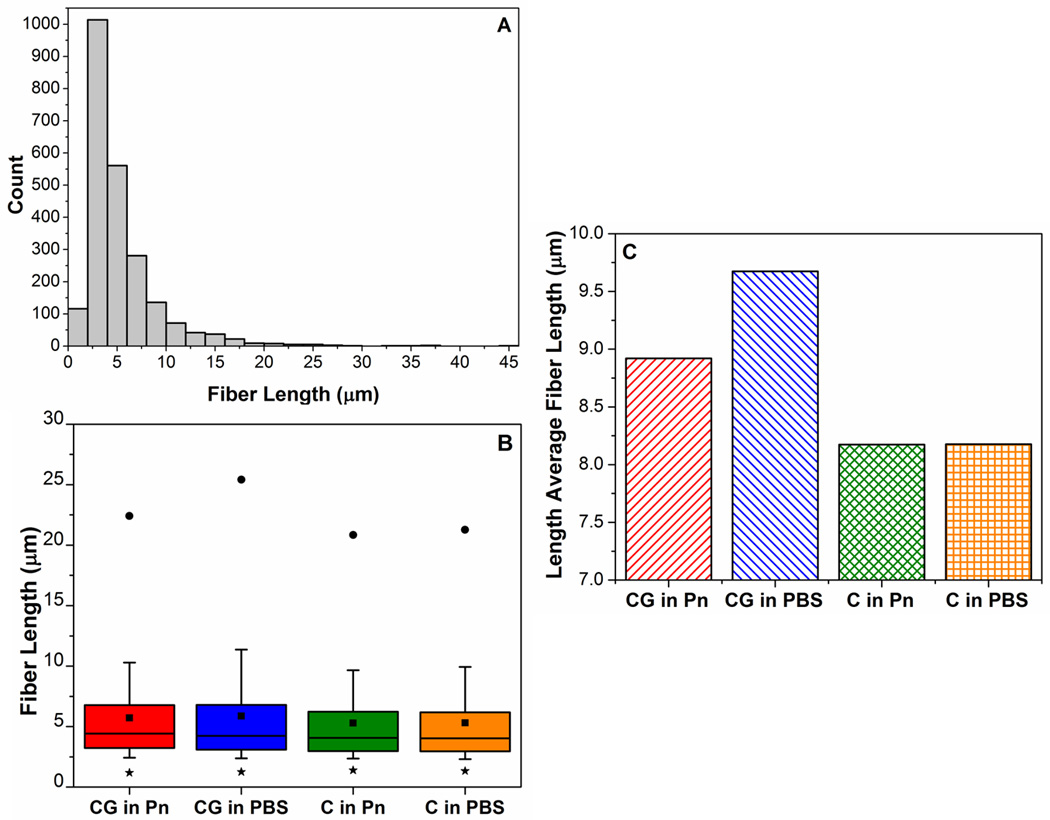
Analysis of fiber lengths and their distributions in the collagen networks from different casting and digestion conditions. (A): Example of the non-normal distribution of fiber lengths in a collagen network (C in Pn). (B) Box-plot comparing fiber distributions; whiskers represent 10th to 90th percentile, ■ represents the mean, * and ● represent 1st and 99th percentile respectively. Co-gels have longer fiber lengths at 90th and 99th percentile, indicating presence of very long fibers vs. pure gels. (C) Higher length-average fiber lengths in the co-gels confirm the presence of very long fibers in the co-gels compared to the pure collagen counterparts.