Figure 3.
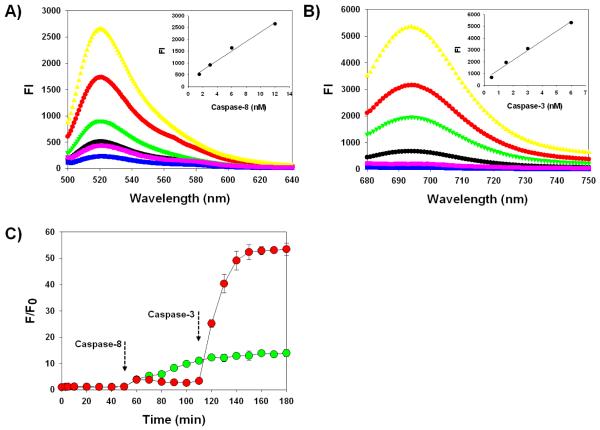
A) Fluorescence emission spectra of C8 in the presence of various concentrations of caspase-8 (in nM, 0 blue, 1.5 black, 3 green, 6 red, 12 yellow) and caspase-8 with inhibitor (purple). Inset: Caspase-8 standard curve. The excitation was set at 456 nm. B) Fluorescence emission spectra of C3 in the presence of various concentrations of caspase-3 (in nM, 0 blue, 0.5 black, 1.5 green, 3 red, 6 yellow) and caspase-3 with inhibitor (purple). Inset: Caspase-3 standard curve. The excitation was set at 675 nm. C) The relative increase in fluorescence emission produced by the mixture of C8/C3 in the presence of caspases-8 and caspase-3, which were added at different time intervals. The excitation and emission was set at 456/522 nm (green) and 675/695 nm (red) and the respective emissions were recorded continuously for 180 min. Data represent means of triplicate experiments with standard deviations.

