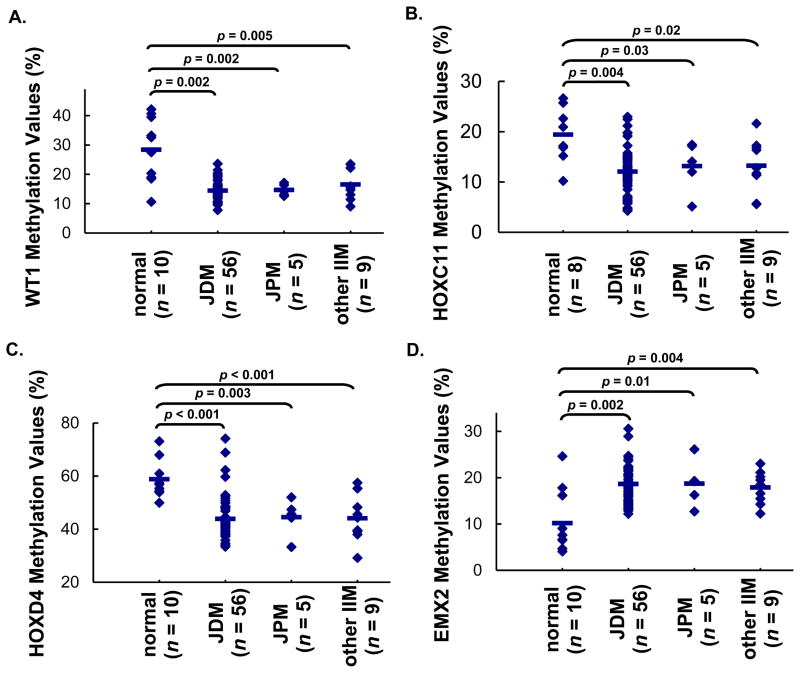
Figure 2. Pyrosequencing verification of the methylation levels of specific genes in JDM and other types of juvenile IIM: WT1 (A), HOXC11 (B), HOXD4 (C), EMX2 (D).
Each dot in the results represented the methylation level of the specific gene in one individual sample and the line represented the average methylation levels for each group. The results confirmed the methylation levels as detected by methylation array. Comparisons among groups were performed by one way ANOVA, followed by post hoc Tukey HSD test. Significant differences were shown between groups: JDM vs. normal, JPM vs. normal, and other IIM vs. normal.

