
Figure 7. TIN2 modulates essential mitochondria function and glucose metabolism.
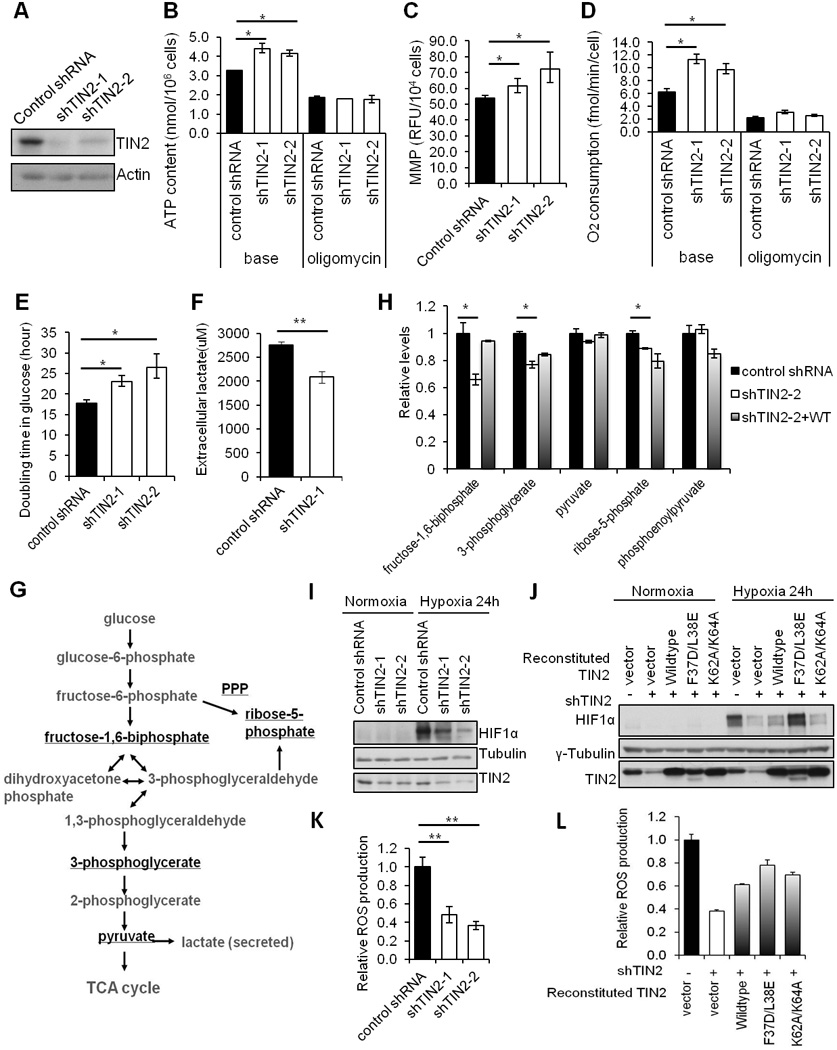
A) Knockdown efficiency of two TIN2 shRNAs in HTC75 cells. B) Total cellular ATP (base) and oligomycin-resistant ATP content were determined using cells from (A). C) Quantification of mitochondrial membrane potential (MMP) of cells from (A). D) Quantification of oxygen consumption in intact cells (base) and following oligomycin treatment. E) Growth analysis of cells from (A) in glucose-containing DMEM media. F) Measurement of media lactate levels of cells from (A). G) Schematic representation of glycolysis. H) Mass spectrometry analysis of glycolytic metabolites in HT1080 cells expressing control shRNA, TIN2 shRNA alone or with RNAi-resistant wildtype TIN2. Relative levels of the underlined metabolites from (G) were plotted. I) TIN2 knockdown MCF-7 cells were cultured under normoxia (21% O2) or hypoxia (1% O2) conditions and western blotted. J) HT1080 cells expressing TIN2 shRNA alone, or with RNAi-resistant wildtype or mutant TIN2 proteins were assessed under normoxia vs. hypoxia conditions. K) Measurement of reactive oxygen species (ROS) in TIN2 knockdown cells. L) Measurement of reactive oxygen species (ROS) in HT1080 cells expressing TIN2 shRNA alone or together with untagged RNAi-resistant wildtype or mutant TIN2. For all panels, error bars represent S.E. (n=3). p values were calculated using Student’s t test (*p<0.05; **p <0.01).