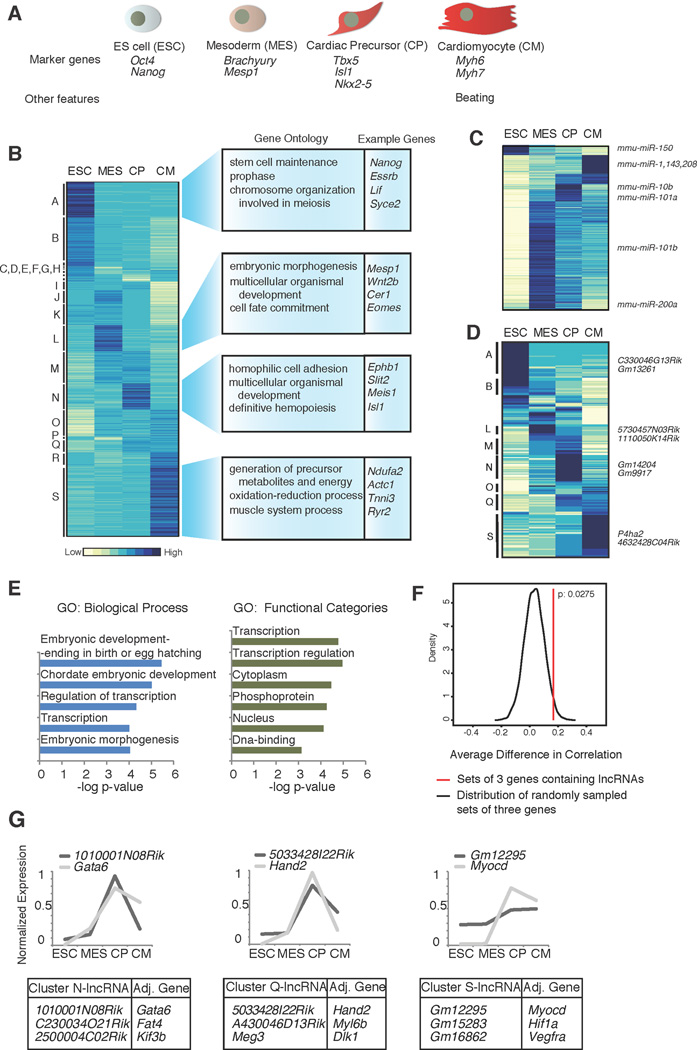
Figure 1. Transcriptional analysis of cardiac differentiation.
A. The four stages of differentiation analyzed in this study. B. Hierarchical clustering of coding and non-coding polyA+ gene expression, across the four cell types. Enriched GO terms and example genes are shown to the right. C. Hierarchical clustering of miRNA expression (565 miRNAs included in NanoString probe set). D. Hierarchical clustering of lncRNA expression including 196 lncRNAs expressed at >1 RPKM in at least one time point. E. Enriched GO terms for the two nearest genes adjacent to the lncRNA genes expressed in the time course. F. Expression correlation between lncRNAs and-adjacent gene minus correlation of adjacent gene with the other neighbour in a three gene set in a 100 kb window, as compared to background model generated by randomly sampling similar sets of three genes. Distribution of the correlation differences in the background is plotted as the black curve. Difference in expression correlation for lncRNAs is significant (P= 0.0275, red line) relative to our background model. G. Example lncRNAs and highly correlated adjacent genes identified in expression clusters N, Q and S. Graphs display examples of genes with known roles in heart development (Gata6, Hand2 and Myocd) and expression pattern during the time course. See also Tables S1 and S2, Figures S1 and S2, and Movie S1.

