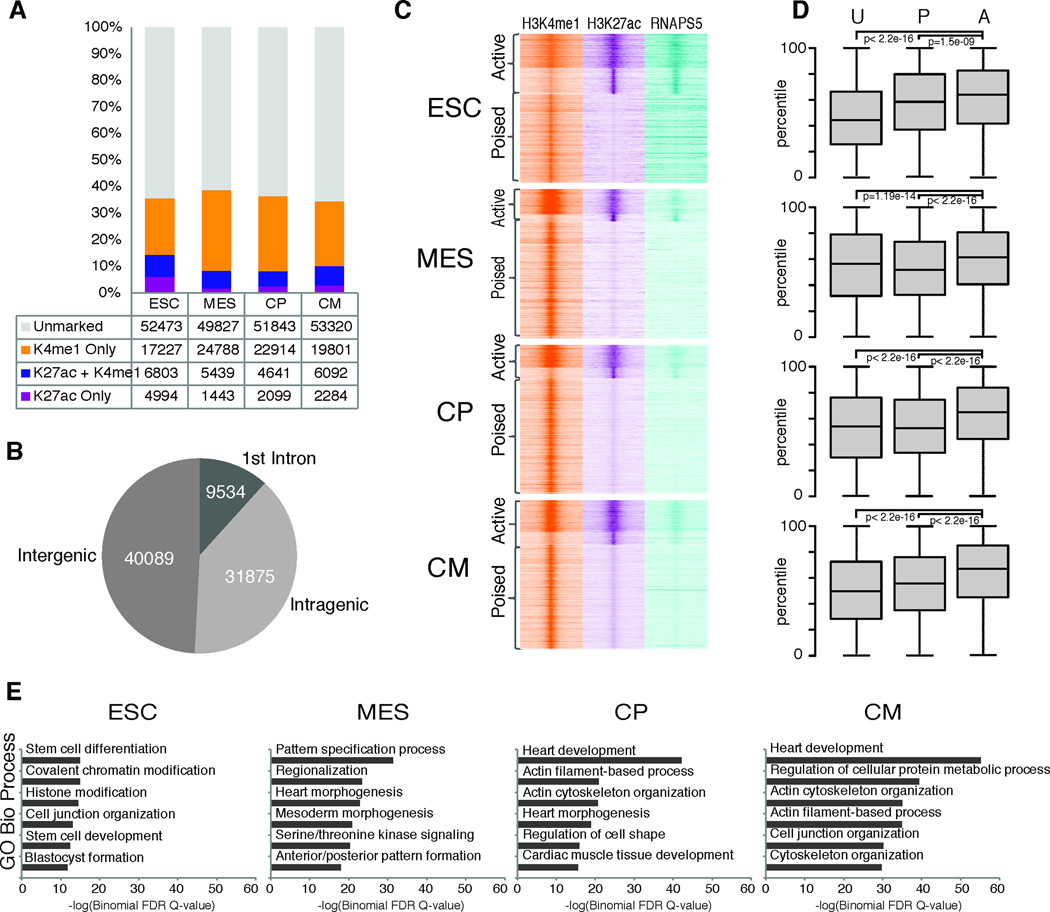
Figure 5. Identification of enhancer elements during cardiac differentiation.
A. Total distal enhancers identified in ESC, MES, CP, and CM categorized by H3K27ac and H3K4me1 status at each stage. B. Distribution of enhancers across the genome. C. Density of ChIP-Seq reads +/− 4kb relative to the midpoint of enriched regions for H3K4me1, H3K27ac and RNA Polymerase (serine 5 phosphorylated form). D. Boxplots of log2 transformed (FPKM) gene expression values for single nearest gene associated with unmarked (U), poised (P), and active (A) enhancer groups. p-values determined by Wilcoxon rank sum test with continuity correction. Boxplots show interquartile ranges (IQR) with whiskers extending to the furthest data point that was no further than 1.5 times the IQR from the interquartile boundaries. E. −Log(Binomial FDR Q-value) scores for GO Biological Process enriched in single nearest gene associated with active enhancers.

