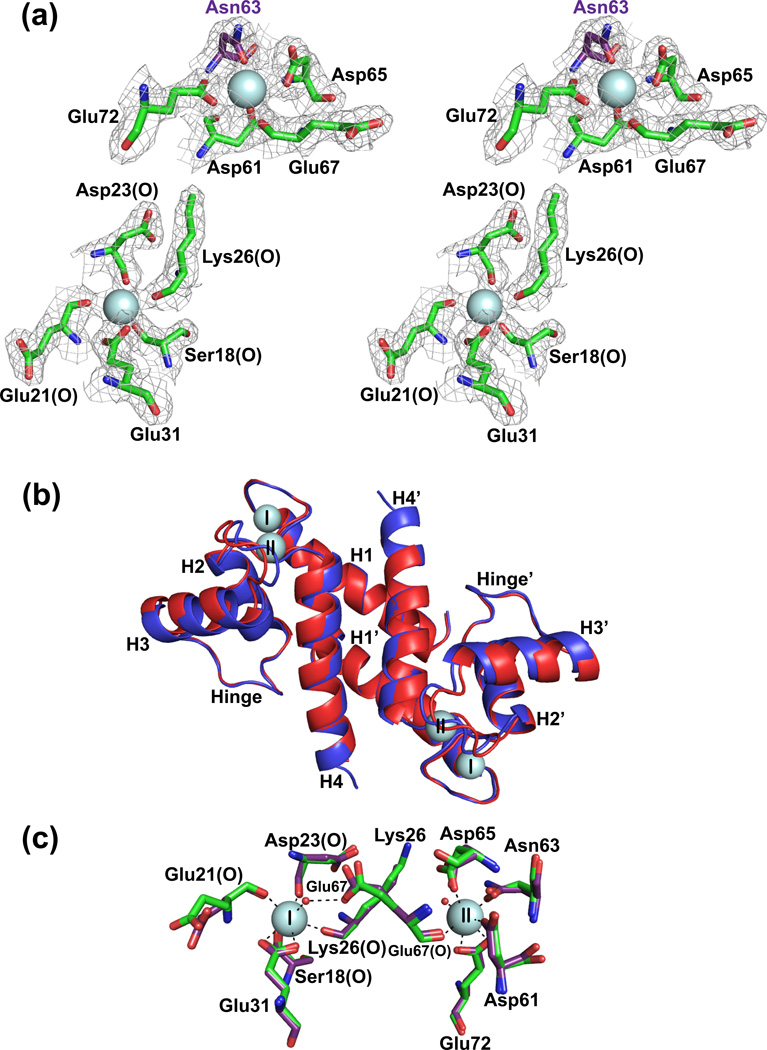
Fig. 2.
Comparison of X-ray crystallographic structures of Ca2+-S100B and Ca2+-D63NS100B in the absence of TRTK-12. (a) Stereo view of the S100-EF-hand (Ser18, Glu21, Asp23, Lys26, and Glu31) and the canonical EF-hand (Asp61, Asp/Asn63, Asp65, Glu67, and Glu72) of the D63NS100B mutant with the Asp63 to Asn63 mutation highlighted in purple. The electron density map was calculated with the 2mFo-DFc coefficients and contoured at 1.0σ for both Ca2+-binding sites. (b) Overlay of Ca2+-bound S100B (in red; PDB ID 3IQO) with Ca2+-bound D63NS100B (in blue; PDB ID 3RL). The most notable difference is that the Ca2+-boundD63NS100B structure extends to Glu89, where as S100B only has interpretable electron density to Phe88. (c) The positions of the side chains of the Ca2+ coordinating residues were compared for the pseudo EF-hand (Ser18, Glu21, Asp23, Lys26, and Glu31) and canonical EF-hand (Asp61, Asp/Asn63, Asp65, Glu67, and Glu72) Ca2+-binding sites for S100B and D63NS100B (purple).

