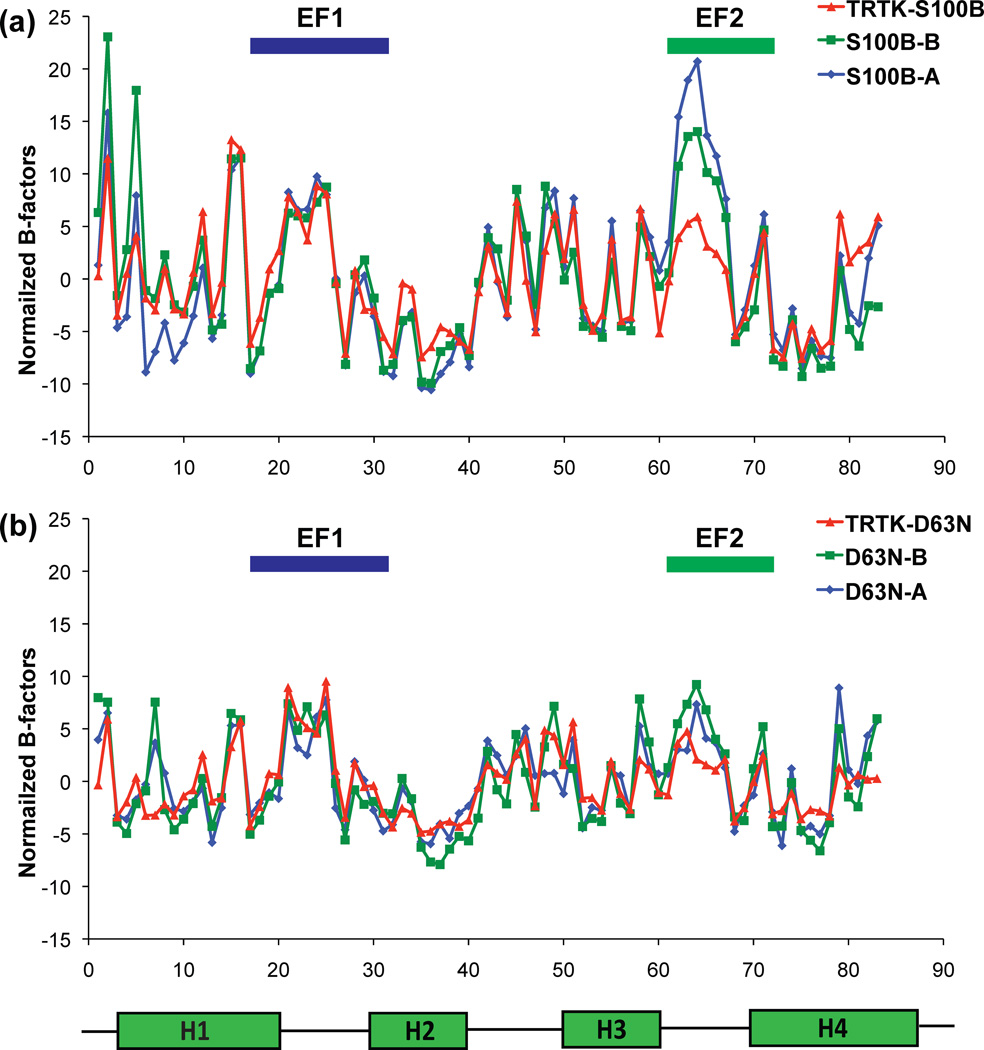
Fig. 4.
Graphs showing normalized B-factor values for each residue in Ca2+-S100B and Ca2+-D63NS100B in the absence and presence of bound TRTK-12. The normalized B-factor was calculated by first averaging all of an atoms’ total B-factors in a given amino acid residue. Next, the average of the total B-factors for each amino acid residue was averaged for the entire protein and subtracted from each averaged individual total B-factor. This was done for every model. Average of all atoms’ normalized B-factors per residue of model A (blue diamonds), model B (green squares), and TRTK-bound protein (red triangles) for (a) D63NS100B and (b) wild type S100B.

