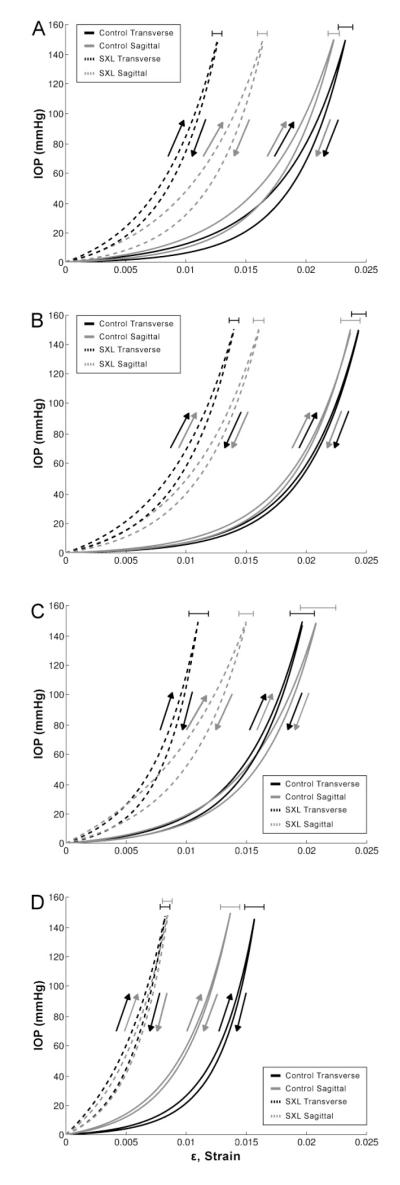
Figure 2.
Composite curve fits of inflation testing data from (A) Group I, (B) Group II, (C) Group III, (D) Group IV. Curves were generated by averaging the sum of the individual functions for each fit along the strain axis. Error bars show standard errors of peak strains
Group I: 1% MG, 120′ whole globe incubation
Group II: 1% MG, 30′ whole globe incubation
Group III: 1% MG, 30′ posterior pole incubation
Group IV: 1% GP, 30′ posterior pole incubation

