Fig. 2.
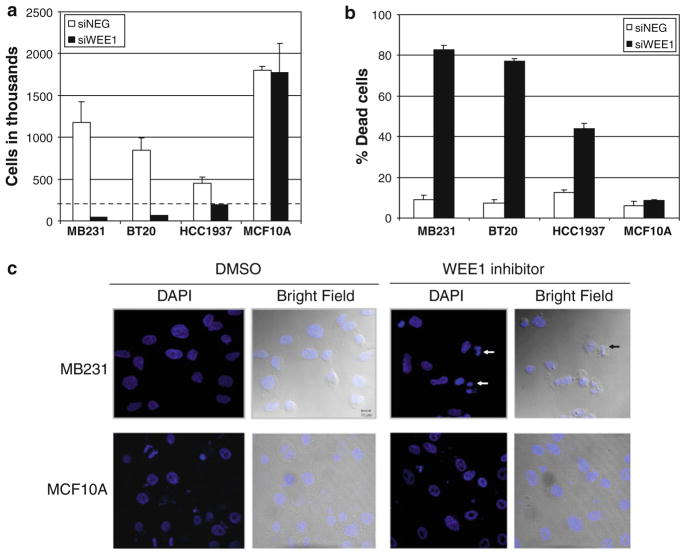
Silencing or inhibition of WEE1 in breast cancer cells results in cell death. a The number of viable and b the percentage dead cells were assessed 5 days post-transfection of the cell lines with either a NEG siRNA pool (white bars) or a WEE1 siRNA pool (black bars). The dotted line in a represents the number of cells plated at the start of the experiment. Data represent mean cell counts ± SE from three experiments. WEE1 silencing resulted in a statistically significant decrease in viable cells (P < 0.05) and an increase in percentage of dead cells (P < 0.005) in the breast cancer cells but not in the MCF10A cells. c Cells treated with WEE1 inhibitor or DMSO control for 4 h were fixed, stained with DAPI, and observed under a LSM 510 confocal microscope. DNA fragmentation (white arrows) and membrane blebbing (black arrow) were observed in inhibitor treated MB231 cells but not in the MCF10A cells

