
Fig. 3. SRS skin imaging in living mice.
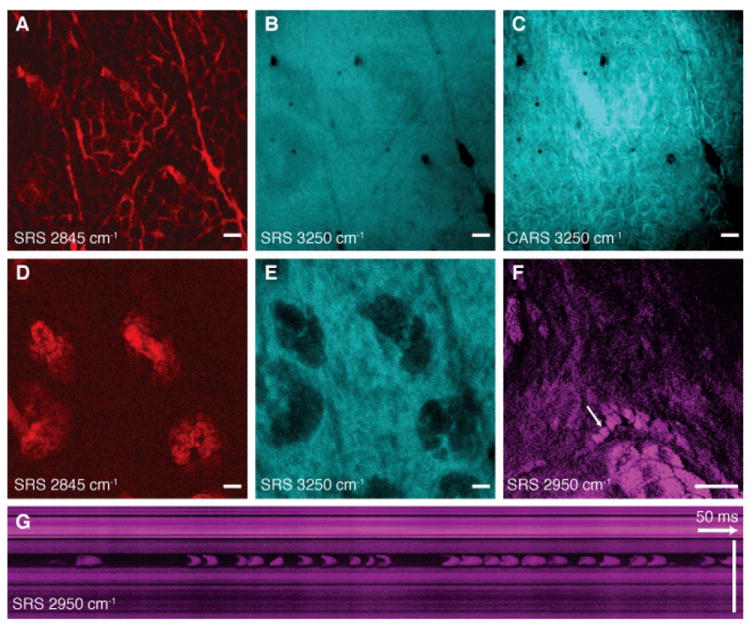
(A) SRS image of lipids of the stratum corneum shows intercellular spaces between hexagonal corneocytes and (B) SRS water image (3250 cm-1) of the same region shows a homogenous distribution of water. (C) A CARS water image acquired simultaneously with (B) shows artifacts from the non-resonant background of lipids. (D) SRS lipid and (E) water images of the viable epidermis show sebaceous glands with positive and negative contrast, respectively. (F) SRS images of the viable epidermis at the CH3 stretching vibration (2950 cm-1) mainly highlights proteins as well as residual lipid-rich structures. A capillary with individual red blood cells (arrow) is visible. The cells are imaged without motion blur due to video rate acquisition speed. (G) SRS in vivo flow cytometry. An x-t plot acquired by line-scanning across a capillary at the position of the arrow in (F). Individual red blood cells are captured on the fly. (A-E) are acquired in epi-direction, while (F) and (G) are acquired in transmission, all with 37 ms / frame acquisition speed and 512 × 512 pixel sampling. Scale: 25 μm.