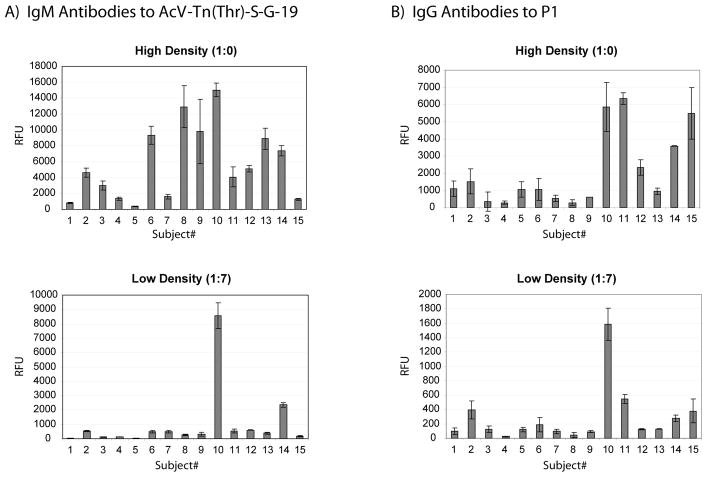
Figure 3.
Serum Antibody Binding to Selected Glycans. Serum antibodies were profiled in 15 healthy subjects (see Experimental for details). A) IgM signals to the glycopeptide, AcV-Tn(Thr)-S-G-19 (average of 19 glycopeptides per molecule of BSA) at high neoglycoprotein density (top) and low (bottom). B) IgG signals to the P1 antigen at high neoglycoprotein density (top) and low (bottom). Error bars represent the standard deviations over 4 spots on 2 different arrays.

