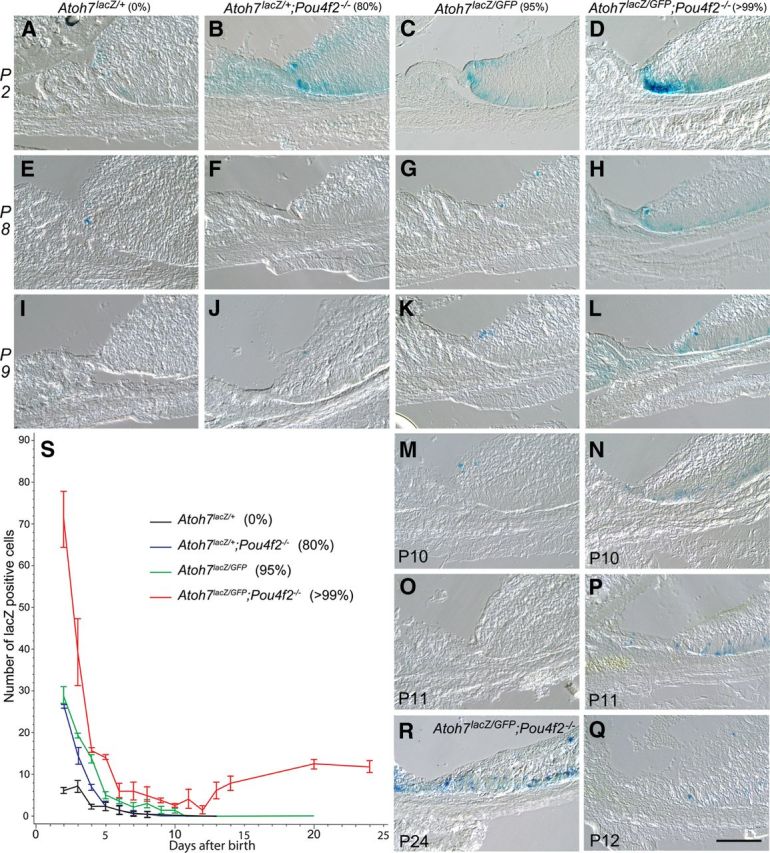
Figure 2.

Cryosections showing Atoh7LacZ expression in the retinal margins of representative retinas from mice with various degrees of RGC deficiencies. Genotypes and associated percentages of RGC loss are listed on the top of each column. Postnatal stages are indicated on the left of each row or the left bottom of each panel. All RGC-depleted retinas exhibit spatial expansion of Atoh7lacZ expression compared with the Atoh7lacZ/+ control retinas (A, E, I) at P2, P8, and P9. Retinas with 80% RGC-depletion (B, F, J) have increased numbers of LacZ-positive cells at P2 with temporal extension of Atoh7 activity to P9. Retinas with RGC loss of 95% (C, G, K, M, O) show both spatial and temporal increases in LacZ-positive cells up to P10, but ceases by P11. Retinas with RGC loss of 99% (D, H, L, N, P, Q, R) show drastic spatial and temporal increases in LacZ-positive cells up to P24. The number of LacZ-positive cells reached the lowest at P12 (Q) with subsequent increase (R, as an example). S, Line graph showing mean numbers (with SDs) of Atoh7lacZ-positive cells in the retinal margin of the four genotypes with various degrees of RGC deficiencies. Each of the four different retinas have distinct pattern of Atoh7lacZ expression as represented by the slope of decrease. Cell counts from Atoh7 LacZ/+;Pou4F2dta/+;Six3-Cre retinas were not included in these statistical comparisons because the overlap in the Atoh7lacZ and Pou4F2dta expression (Kiyama et al., 2011) may result in the death of a significant portion of the Atoh7LacZ cells and preclude meaningful comparisons with the other strains. Scale bar, 100 mm.
