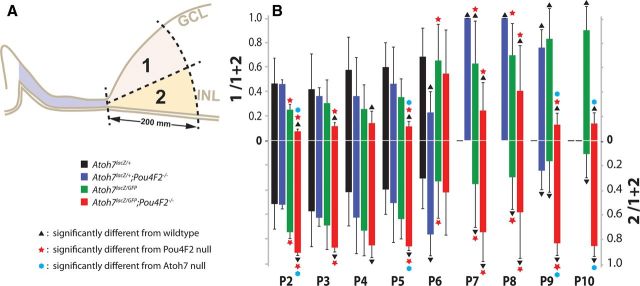
Figure 3.
Comparisons of LacZ-positive cell numbers in retinal margin subareas. A, Legend marks and a diagram showing an arbitrary line was drawn to divide the retinal margin equally into the vitread (GCL) half and ventricular (photoreceptor) half. LacZ-positive cells within areas 1 (vitread) and 2 (ventricular) were counted. B, Bar graph showing the mean ratio (±SD) of LacZ-positive cells in area 1 (upper half) and area 2 (lower half) to the total number of LacZ-positive cells for each genotype.

