
Figure 4.
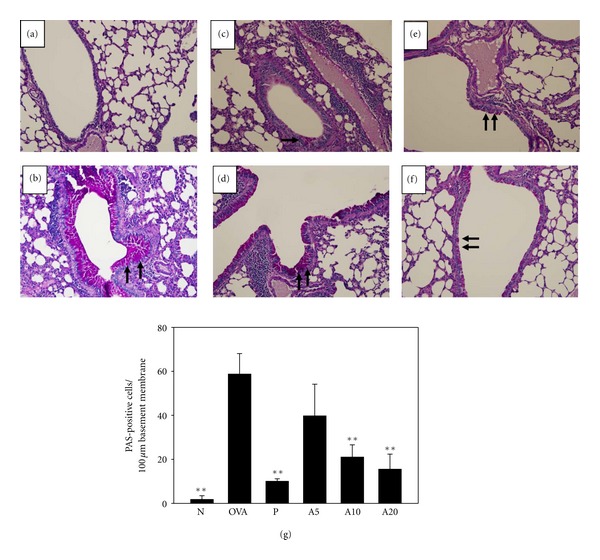
The effects of acacetin on goblet cell hyperplasia in lung tissue. Lung sections were stained with PAS stain to analyze goblet cell hyperplasia for normal (a), OVA (b), prednisolone (c), A5 (d), A10 (e), and A20 (f) groups (200x magnification). Goblet cells are indicated by arrows. Graphs represent the number of PAS-positive cells per 100 μm of basement membrane (g) and were expressed as means ± SEM. **P < 0.01 compared with OVA control mice.