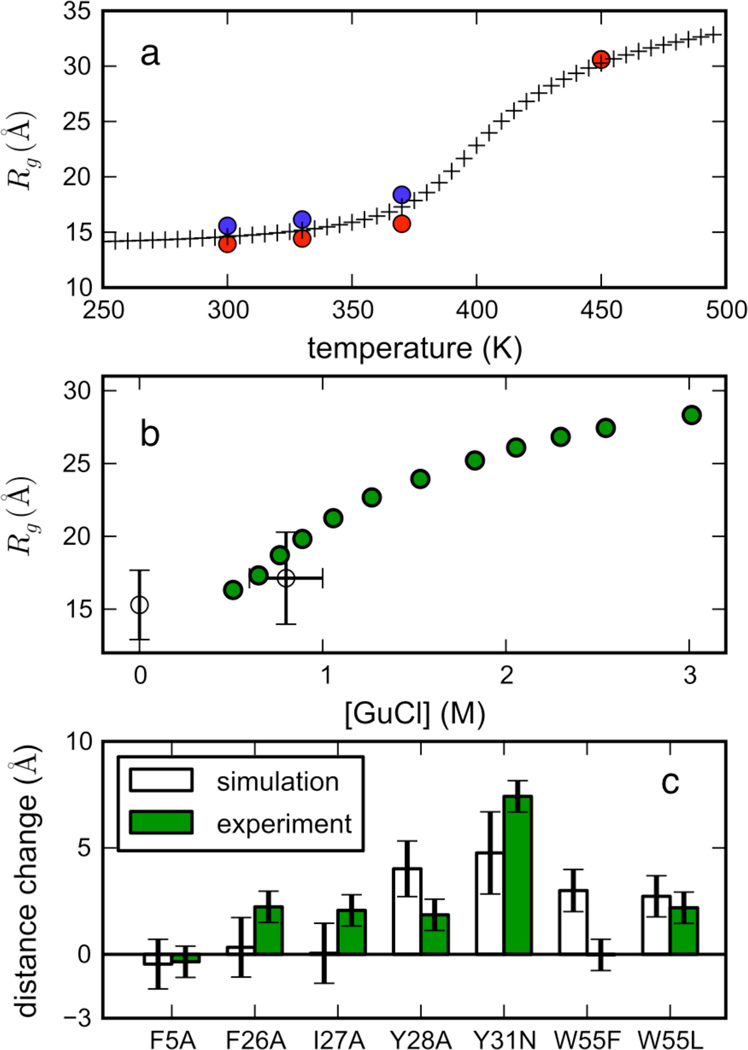
Figure 6.
(A) Radius of gyration (Rg) vs. temperature for simulated unfolded-state ensembles started from extended (blue) and coil (red) conformations (after ~5 µs), shown with the best-fit (i.e. maximum-likelihood) polymer theory model (crosses, see SI for details). Note that the Rg values superimpose at 450K. (B) Estimated radius of gyration (average of extended and coil values) from simulations (unfilled circles) at 0 M GuHCl (330 K) and ~0.8 M GuHCl (370 K) agree well with experimental Rg for ACBP 1–88 measured by smFRET (green circles) (see SI for details of the calibration of simulated temperature with experimental denaturant concentration). Horizontal error bars reflect uncertainty in the calibration, while vertical error bars denote the variance of Rg values across extended and coil ensembles. (C) Predicted (white) versus experimental (green) changes in average end-to-end distances due to perturbing mutations. Changes in the expectation value of interresidue distance 17–86 for several ACBP mutants were calculated from simulated unfolded-state ensembles (370 K, 0.6–1.0 M GuHCl) using coarse-grained FEP calculations (see Methods, SI section B.6). The experimental changes in end-to-end distances ΔRee, were calculated from the smFRET Rg values at 0.5 M GuHCl, using the random coil identity 〈Rg2〉 = 〈Ree2〉/6. Error bars for ΔRee are calculated from uncertainties in Rg.

