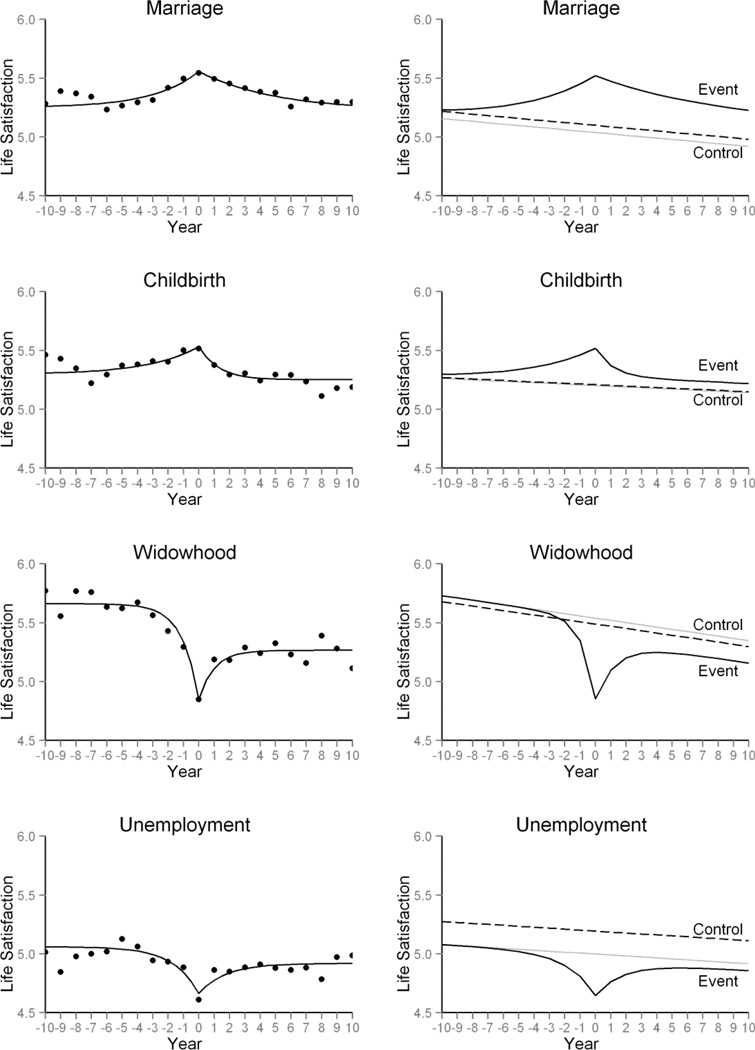
Figure 1.
Estimated life satisfaction trajectories from the models that did not include normative change in life satisfaction (on left) and models that did (on right) for the four life events are shown as dark solid lines. Points indicate mean life satisfaction in the groups that experienced an event. Dashed lines show estimated life satisfaction trajectories in the groups that did not experience the event. Lighter lines show predicted life satisfaction trajectories in the event groups if they did not experience the event, but had same initial levels of life satisfaction and experienced same normative changes.

