
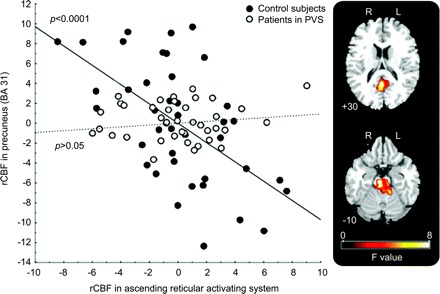
Figure 2 Plot of the regression of neural activity in ascending reticular activating system and in precuneus
F values, corrected p < 0.05 in controls (full circles: slope, r = 0.58, p < 0.0001) and in patients in persistent vegetative state (PVS) (open circles: slope, r = 0.08, p = not significant). During PVS, an impaired functional connectivity was found between the ascending reticular activating system and precuneus (difference between slopes F = 16.3, p < 0.0001). rCBF = regional cerebral blood flow.