
Figure 3.
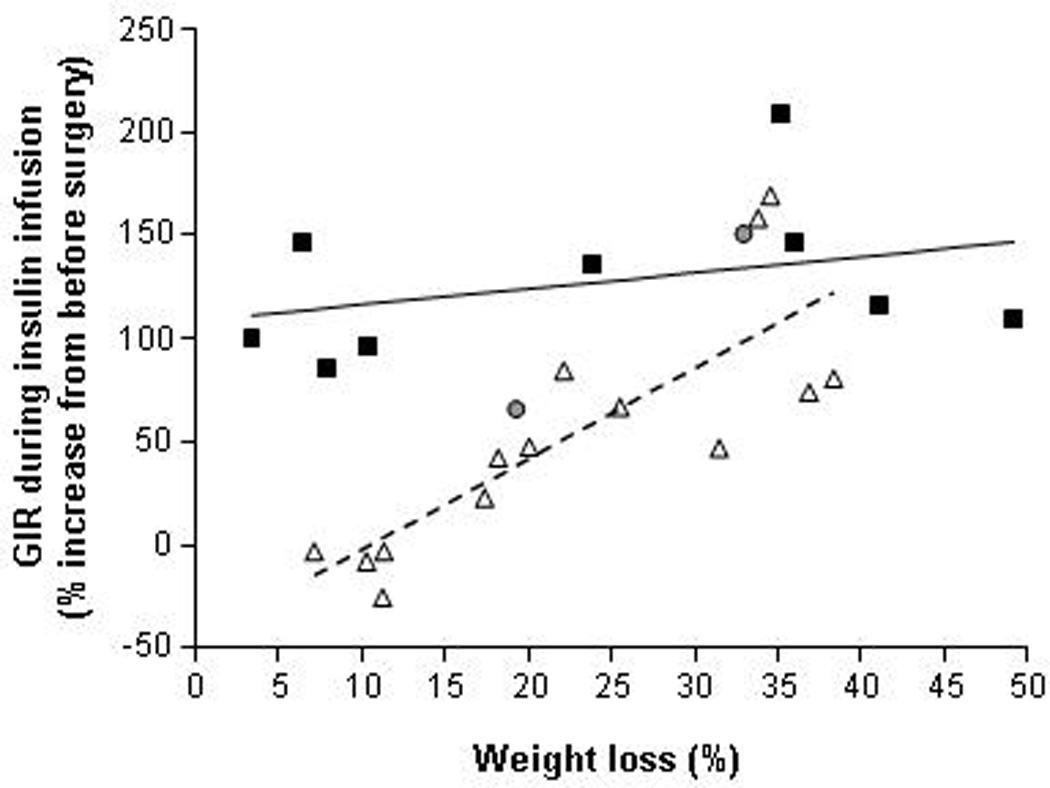
Relationship between percent weight loss and the change in insulin sensitivity, assessed as the relative increase in insulin-mediated glucose disposal (% change in glucose infusion rate [GIR] in µmol/kg fat-free mass per min) during a hyperinsulinemic-euglycemic clamp procedure (insulin infusion rate of 40–50 mU/m2 body surface area per minute) in subjects who had RYGB (white triangles), LAGB/gastroplasty (grey circles) or BPD (black squares) surgeries. Each data point represents the average change insulin sensitivity at a specific average percent weight loss within a study, calculated by using group mean values from published studies that reported adequate data to make these calculations.50,51,91,112,113,128–136 The linear regression lines for RYGB (dashed black) and BPD (continuous black) are shown.