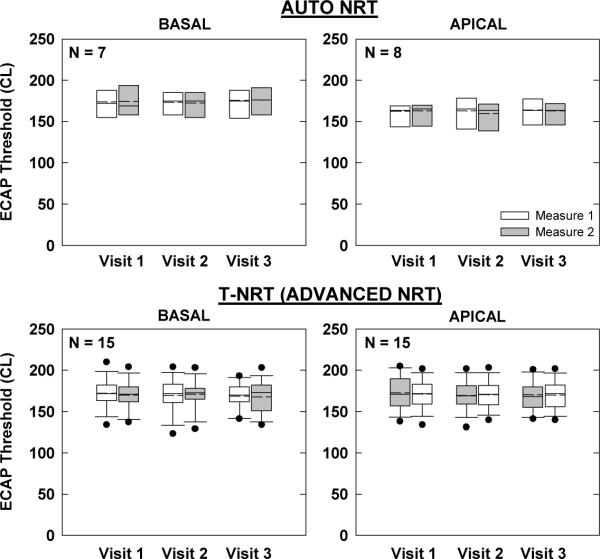
Figure 4.
Box-and-whisker plots illustrating electrically evoked compound action potential (ECAP) thresholds for Nucleus recipients across visits and measures. Top: ECAP thresholds using AutoNRT in Custom Sound EP. (Whiskers and outliers not calculated due to small sample size.) Bottom: ECAP thresholds using default settings in Advanced NRT (Custom Sound EP) with linear regression applied to computer-picked peaks (T-NRT). Basal and apical electrodes are shown in the left and right columns, respectively.

