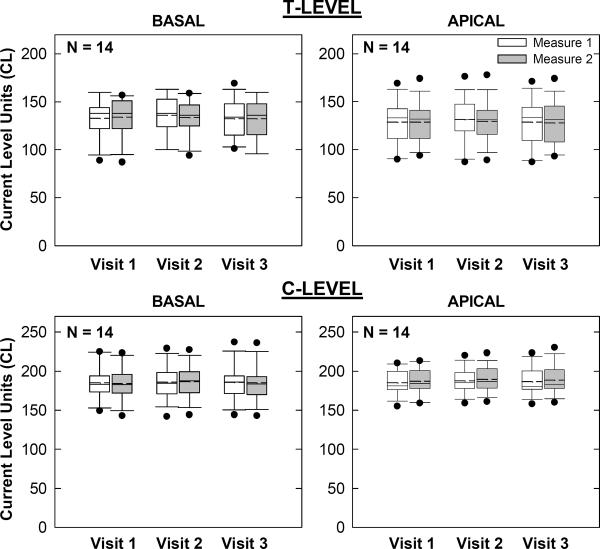
Figure 7.
Box-and-whisker plots illustrating map thresholds (T-levels) and comfort levels (C-levels) for 14 of the 15 Nucleus subjects across visits and measures. Data could not be obtained for one subject at any visit (see text). Basal and apical electrodes are shown in the left and right columns, respectively.

