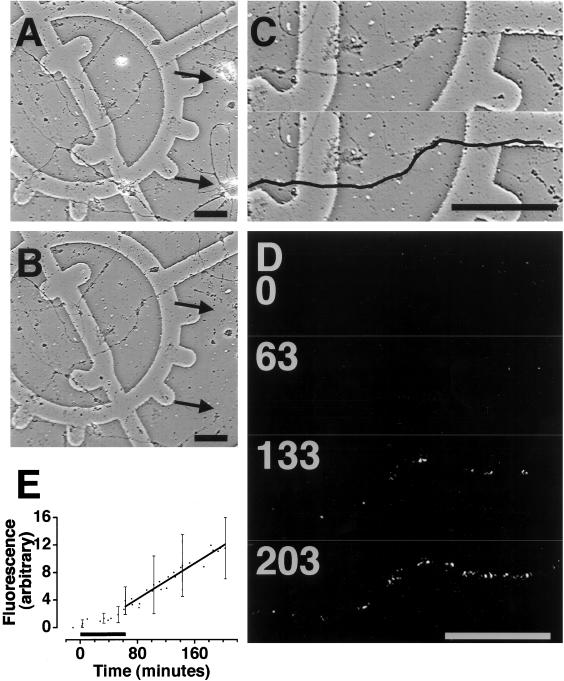
Figure 3.
Transfection of isolated dendrites with GFP mRNA results in fluorescence. (A and B) Phase images of 4-day-old primary hippocampal neurons grown on grided coverslips. Arrows indicate positions of cell bodies removed with a micropipette. (C) Two identical enlarged images of one dendrite from B. Bold black line indicates the position of the dendrite. (D) Four fluorescence images of dendrite in B before (0) and after (63, 133, and 203 min) transfection with GFP mRNA. Images were contrast-stretched in National Institutes of Health image for display purposes. (Scale bars = 50 μm.) (E) Mean fluorescence in isolated dendrites over a time course of hours. Black bar indicates period of transfection with GFP mRNA. n = 3.

