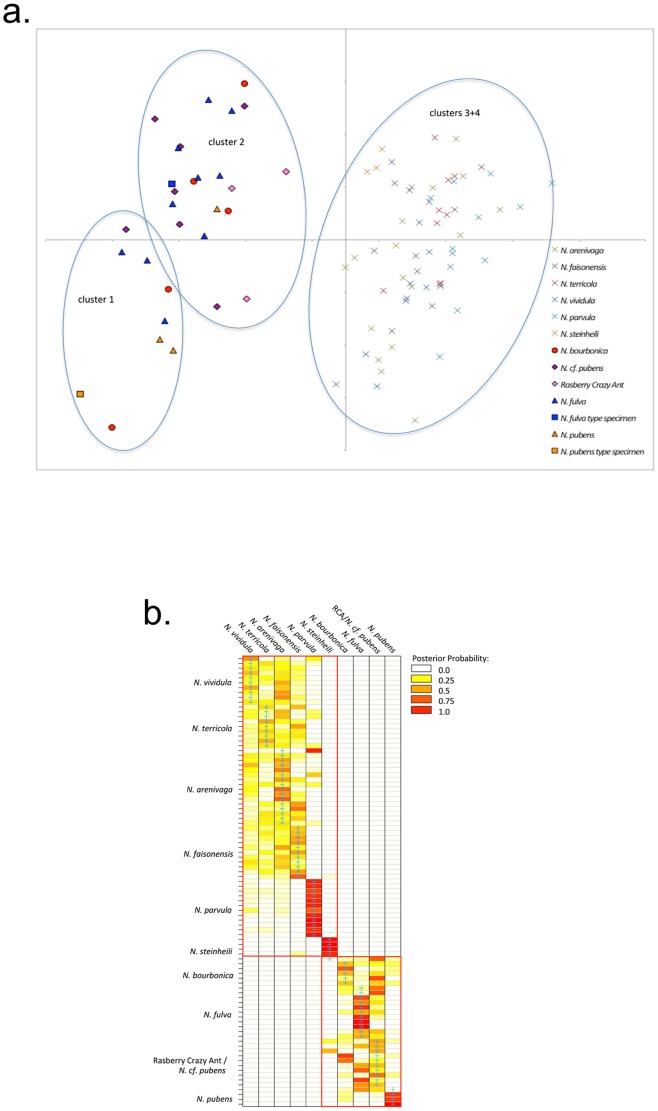
Figure 2. Results of the discriminant analysis of principal components (DAPC) of 14 morphometric measurements.
Species are color-coded. a) Scatter plot of the first two discriminant functions based on k-means clustering. Variable contribution (>10% loading) to the first axis is primarily scape length, profemur length, gaster length, total length, and Weber’s length, whereas gaster length, mesonotum setae count, and total length contribute to the second axis. b) Heat map of assignment probabilities of individual samples (rows; order identical to Table S1) to species (columns) based on discriminant functions. Blue crosses indicate group membership as assigned by the authors (i.e. species membership). Cluster assignment based on k-means clustering is shown by red rectangles (lower right: clusters 1+2; upper left: clusters 3+4).

