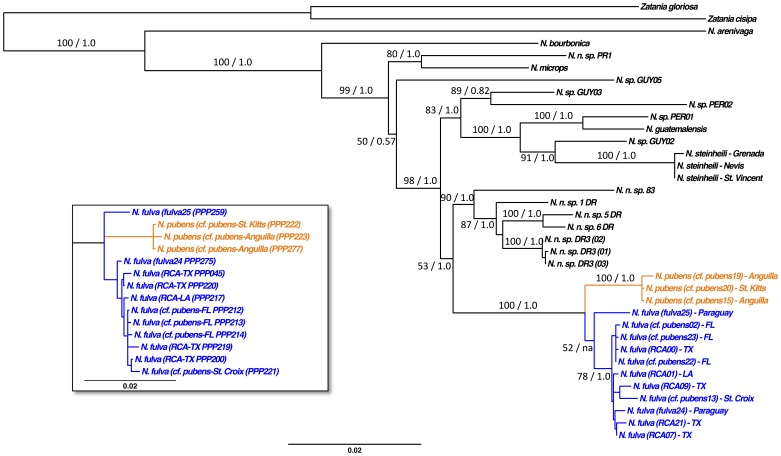
Figure 3. Phylogenetic tree estimation of six concatenated loci.
Shown is the maximum likelihood phylogeny. Branch support values (maximum likelihood bootstrap and Bayesian posterior probabilities [BS/PP]) are shown except on the very short branches. The inset shows the unresolved Bayesian analysis for the Nylanderia fulva complex. Nylanderia fulva samples are shown in blue, N. pubens sample are indicated in orange.

