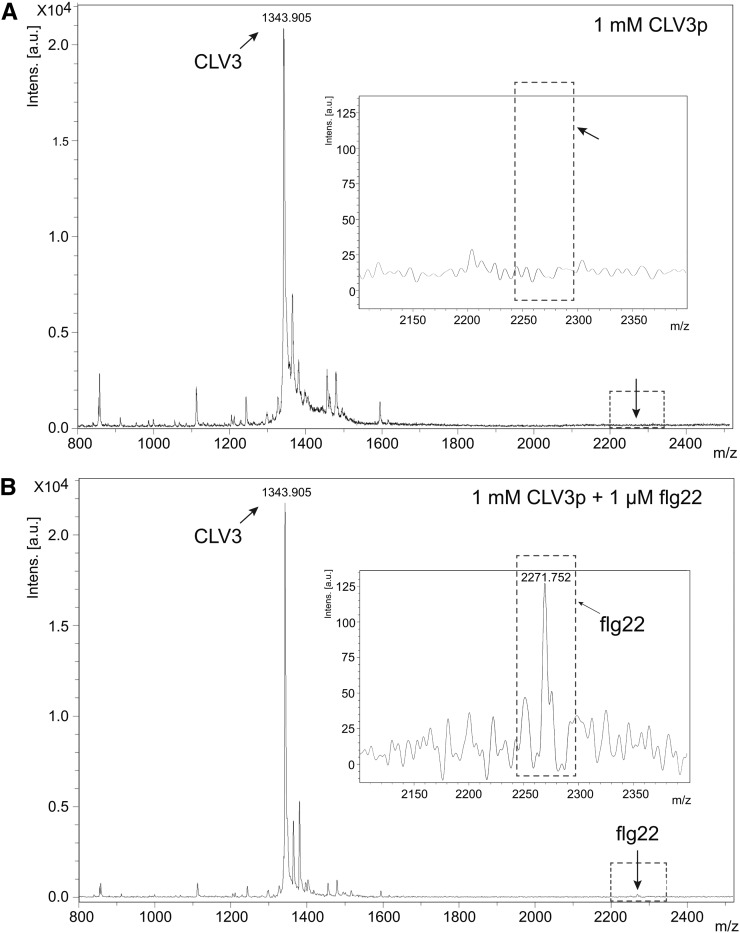
Figure 4.
Analysis of CLV3p and flg22 by MALDI-TOF MS.
(A) Mass spectrum of 0.5 nM CLV3p (0.5 μL spotted from a 1 mM solution).
(B) Mass spectrum of 0.5 nanomole of CLV3p mixed with 0.5 pM of flg22 (0.5 μL spotted from a solution of 1 mM CLV3p containing 1 μM flg22).
Insets show the magnified portion of the spectrum in the region of flg22 mass (mass range 2100 to 2400). Arrows represent the same position in (A) and (B). a.u., arbitrary units; m/z, mass-to-charge ratio.

