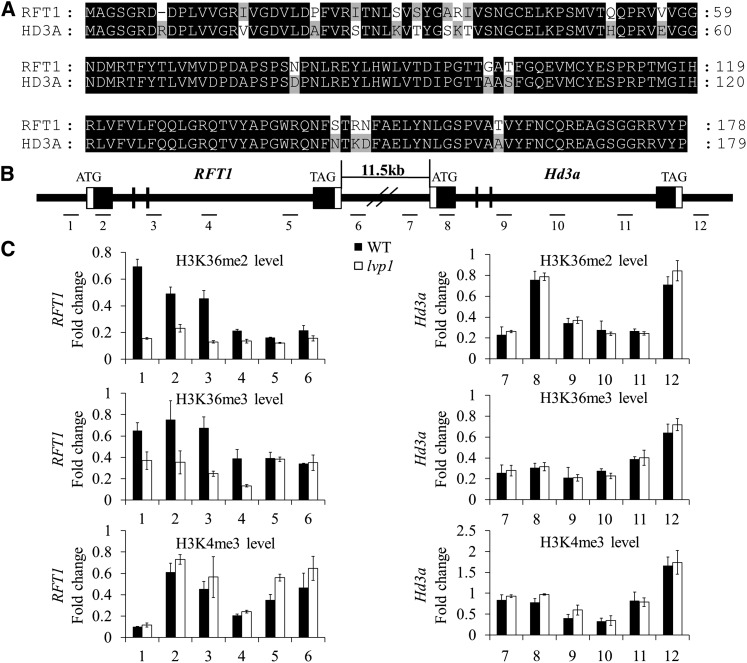
Figure 7.
H3K36me2/3 Levels Are Severely Reduced at the RFT1 Locus in lvp1 Mutant Plants.
ChIP samples were analyzed by quantitative PCR of six different regions of each gene. The rice Actin1 gene was used as an internal control. The relative levels of specific histone H3 Lys methylation marks were calculated as the ratio of specific methylation marks over total H3 and normalized as the ratio over total H3 at Actin1; error bars indicate sd (n = 3 or more). Primers are listed in Supplemental Table 1 online.
(A) Alignment of RFT1 and Hd3a protein sequences using ClustalX and GenDoc. Shades of black indicate conserved amino acids.
(B) Genomic structure of the RFT1 and Hd3a loci on chromosome 6. Black boxes indicate exons, and white boxes indicate untranslated regions. Regions assayed in (C) are indicated by lines and numbered.
(C) ChIP analysis quantifying H3K36me2/3 and H3K4me3 levels in the chromatin of the RFT1 and Hd3a loci in wild-type (WT) and lvp1 mutant plants.

