Figure 2.
Spatial Patterns of VOZ Expression.
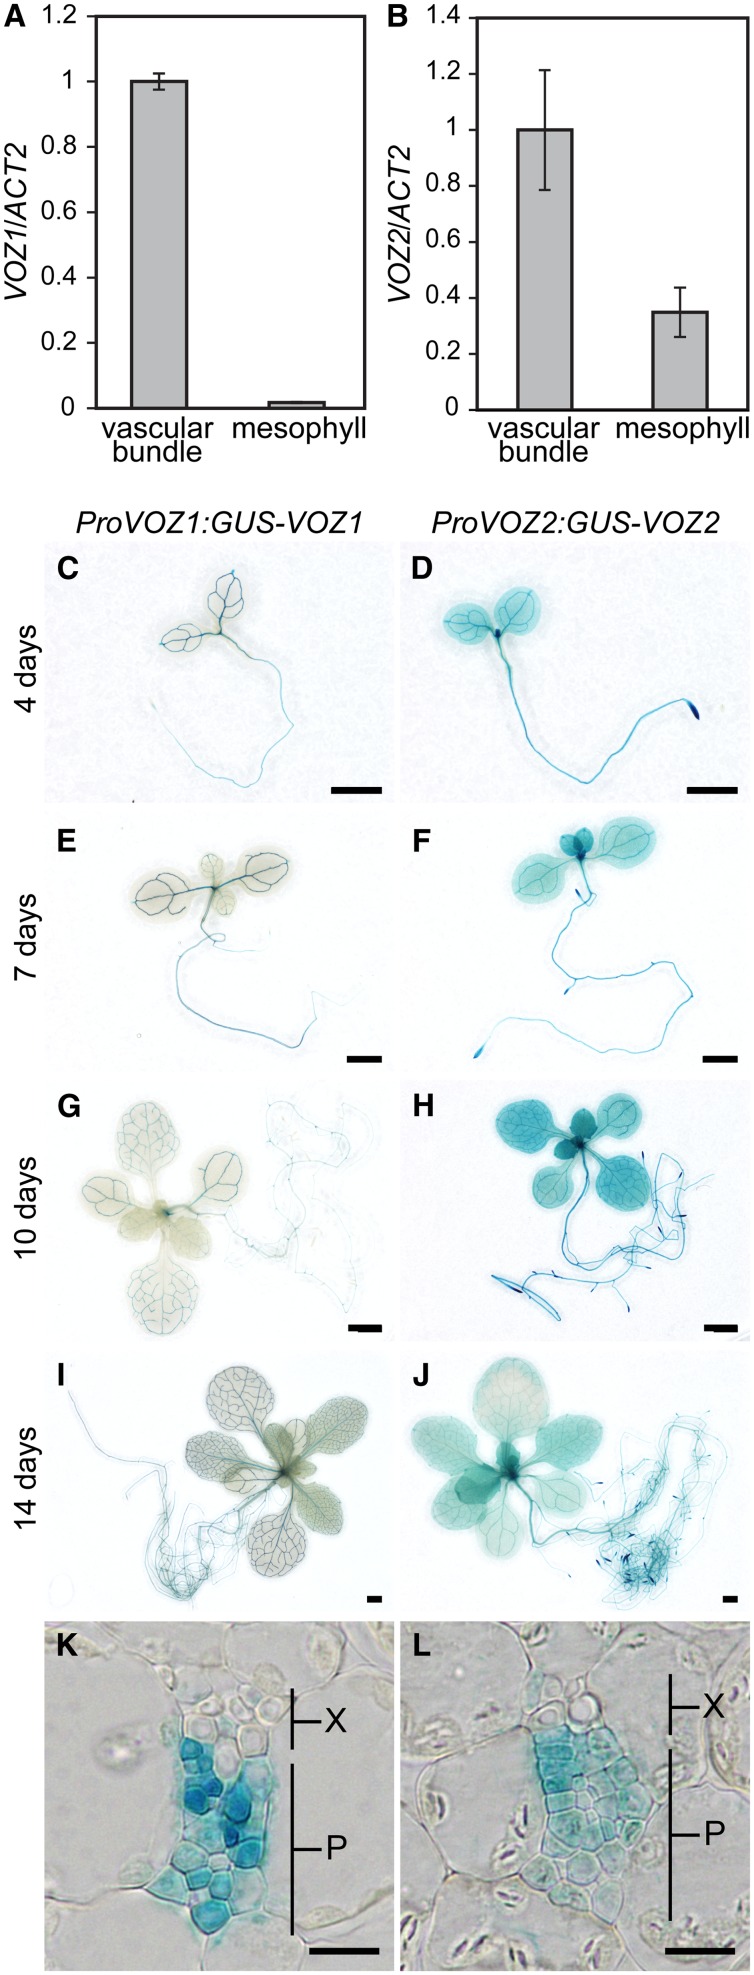
(A) and (B) Mesophyll protoplasts and vascular bundles were isolated from cotyledons and VOZ1 or VOZ2 RNA levels were determined by quantitative RT-PCR and then normalized to ACT2. Seedlings were grown under LD conditions for 10 d. ACT2 was used as a control. RNA extraction was performed three times independently. Data are the mean ± se (n = 3).
(C) to (J) Representative GUS staining of ProVOZ1:GUS-VOZ1 #2 ([C], [E], [G], and [I]) and ProVOZ2:GUS-VOZ2 #1 ([D], [F], [H], and [J]) transgenic lines. LD-grown seedlings were analyzed on day 4 ([C] and [D]), day 7 ([E] and [F]), day 10 ([G] and [H]), and day 14 ([I] and [J]). Bars = 1 mm.
(K) and (L) Transverse sections through cotyledon of ProVOZ1:GUS-VOZ1 #2 (K) and ProVOZ2:GUS-VOZ2 #1 (L) transgenic plants. P, phloem; X, xylem. Bars = 10 μm.

