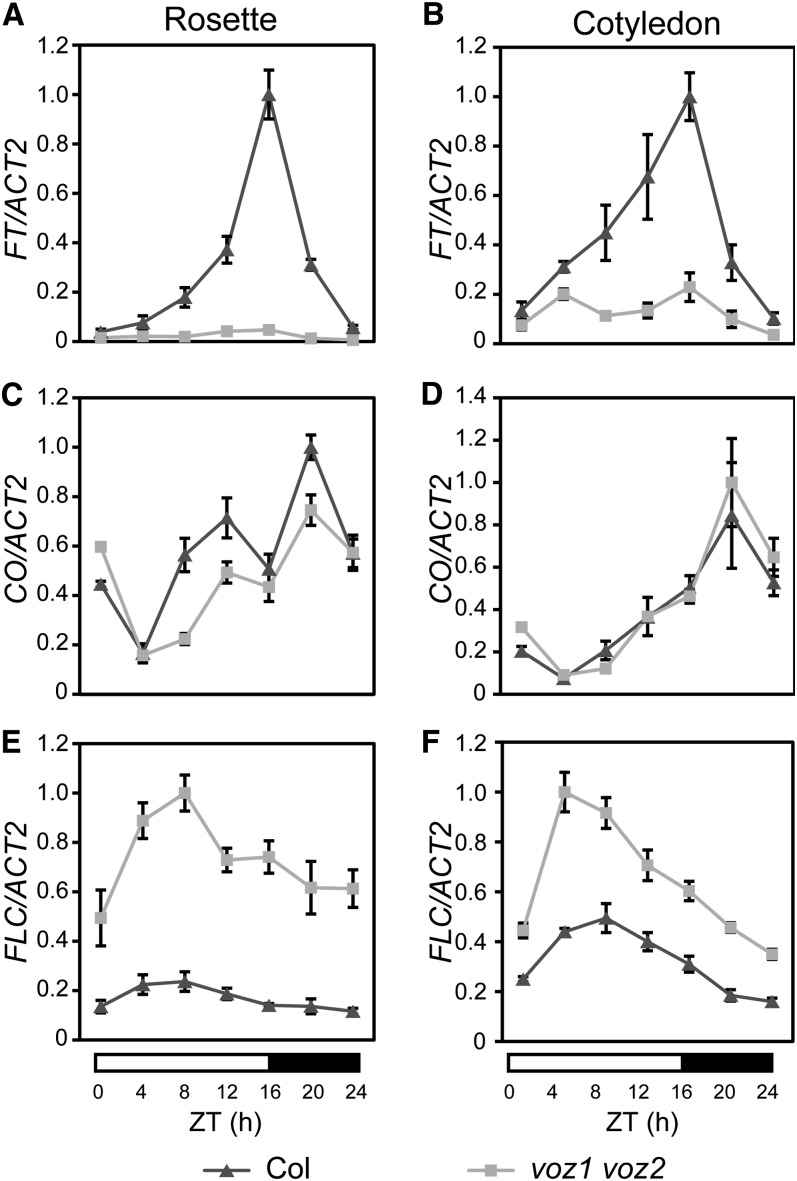
Figure 3.
Relative Expression Levels of FT, CO, and FLC in the Wild Type and voz1 voz2 Mutant.
Relative expression levels of FT ([A] and [B]), CO ([C] and [D]), and FLC ([E] and [F]) were determined by quantitative RT-PCR in Col (triangles) and voz1 voz2 mutant (squares). Plants were grown for 10 d under LD conditions and harvested at the indicated times. RNA was extracted from rosette leaves ([A], [C], and [E]) or cotyledons ([B], [D], and [F]). ACT2 was used as a control. RNA extraction was performed three times independently. Data are the mean ± se (n = 3). ZT, zeitgeber time.

