Figure 6.
Interaction between phyB and VOZ1/VOZ2 in Vivo.
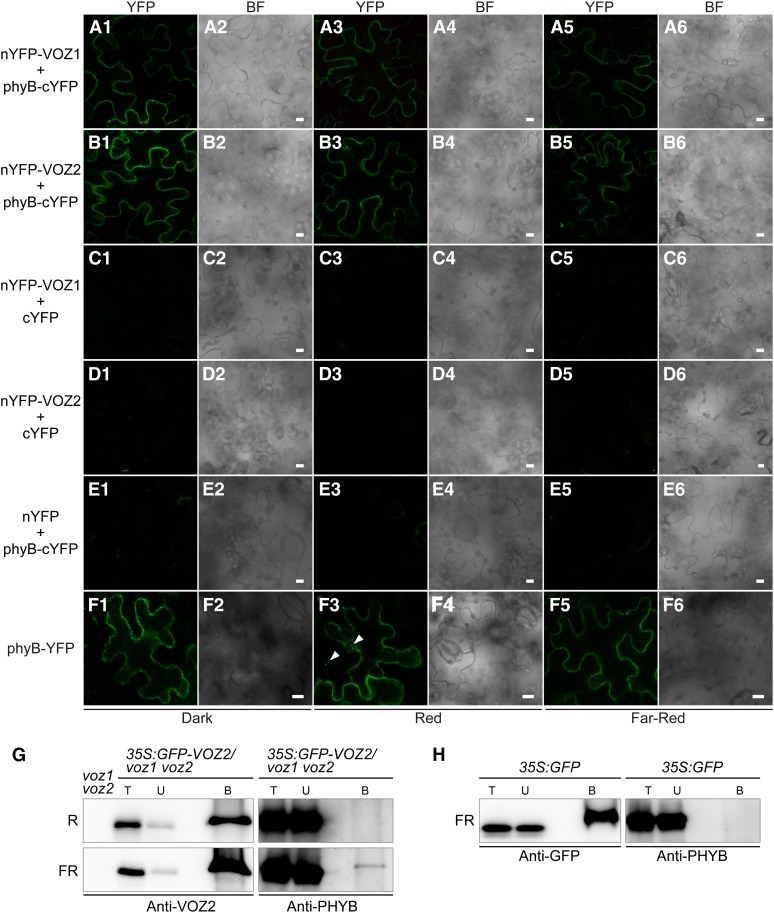
(A1) to (F6) BiFC analysis of phyB and VOZ1/VOZ2. Confocal images of YFP ([A1] to [F1], [A3] to [F3], and [A5] to [F5]) and bright-field (BF) images ([A2] to [F2], [A4] to [F4], and [A6] to [F6]) from epidermal cells of N. benthamiana infected with Agrobacterium harboring the constructs described below under dark ([A1] to [F1] and [A2] to [F2]), red ([A3] to [F3] and [A4] to [F4]), and far-red ([A5] to [F5] and [A6] to [F6]) conditions. Bars = 10 μm. BiFC analysis of the interaction between VOZ1 and phyB ([A1] to [A6]) and VOZ2 and phyB ([B1] to [B6]). VOZ1 and VOZ2 were fused to nYFP, and phyB was fused to cYFP to generate nYFP-VOZ and phyB-cYFP, respectively. A vector containing only nYFP or cYFP was used as a negative control ([C1] to [C6], [D1] to [D6], and [E1] to [E6]). phyB subcellular localization was observed with the Pro35S:PHYB-YFP construct ([F1] to [F6]). Arrows indicate nuclear speckles.
(G) and (H) Co-IP of GFP-VOZ2 or GFP from Pro35S:GFP-VOZ2 and Pro35S:GFP plant extracts, respectively, using anti-GFP antibody-tagged microbeads. Plants were grown under continuous white light for 9 d and treated with either red (R) or far-red (FR) light for 8 h. B, bound fraction; T, total fraction; U, unbound fraction.
[See online article for color version of this figure.]

