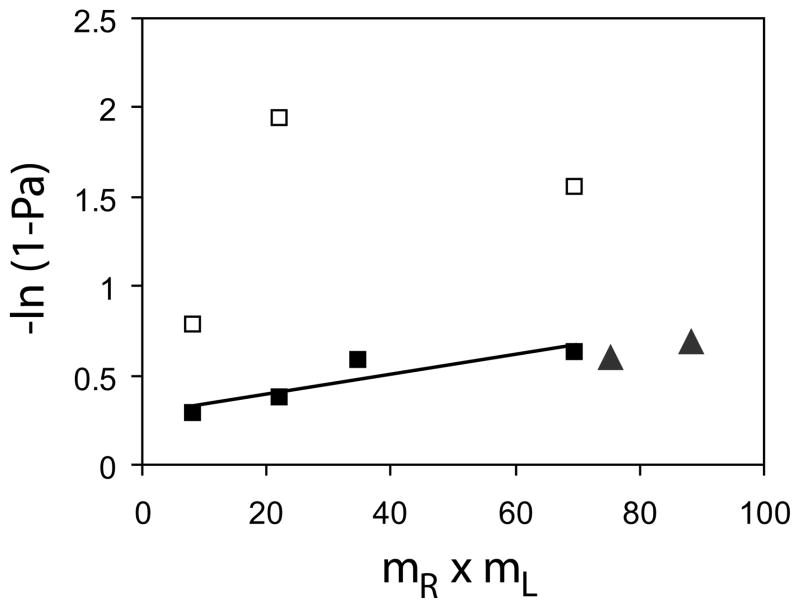
FIGURE 5. Semilog plot of the probability of total adhesion (−Ln(1 − Pi)) versus the product of surface densities of cadherin on the two cells (mR × mL).
The black squares show the data from Fig. 2B normalized relative to the first plateau (P1) and the white squares are data normalized relative to the second plateau (P2). The black triangles show the data obtained with C-CHO and CEC1245-Fc RBCs normalized relative to the limiting plateau in Fig. 4.

