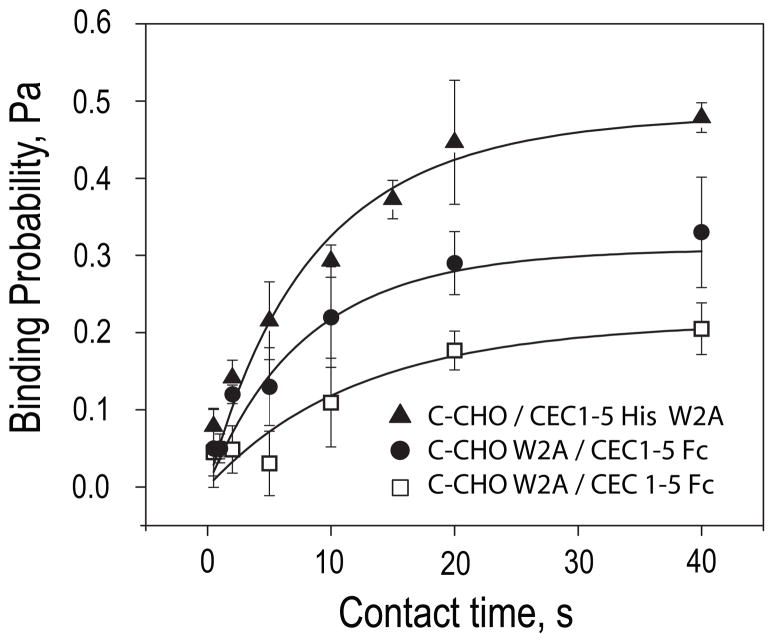
FIGURE 6. Adhesion time courses between cadherin W2A mutants and wild-type cadherin.
Adhesion probabilities measured between C-CHO (44 cadherin/μm2) and CEC1–5-His6 W2A on the RBC (556 cadherin/μm2) (black triangles); C-CHO W2A (24 cadherin/μm2) and CEC1–5-Fc RBC (328 cadherin/ μm2) (black circles); and C-CHO W2A (24 cadherins/μm2) and CEC1–5-Fc RBC (453 cadherin/μm2) (white squares). The background binding probability was subtracted from all data. The solid lines through the data are the weighted nonlinear least squares fits to Equation 2. The best-fit parameters are summarized in Table 1.

