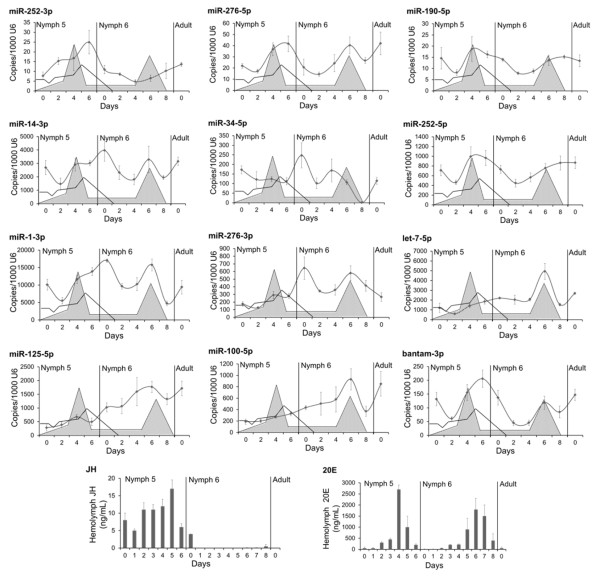
Figure 2.
Expression pattern of the 12 miRNA selected from the comparison of the N5 and N6 libraries in Blattella germanica. miRNA levels were measured on nymph 5, nymph 6 and in freshly emerged adults with qRT-PCR; data represent the mean ± SEM, and are indicated as copies of the respective miRNA per 1000 copies of U6; each point represents 3 biological replicates. Schematic patterns of juvenile hormone III (JH) and 20-hydroxyecdysone (20E) titers in nymph 5 and nymph 6 are superimposed in every graphic as empty and grey patterns, respectively. Actual values of JH and 20E titers are represented in the two bottom panels, according to the data of Treiblmayr et al. [41] (JH) and Romaña et al. [15] (20E).

