Figure 1.
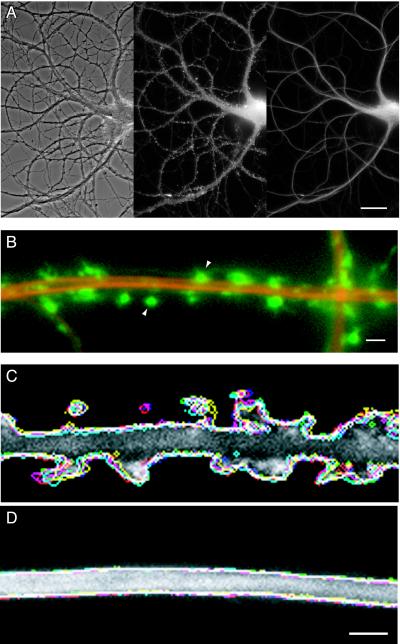
Actin and MAP2 differ in both distribution and dynamics in living hippocampal neurons. (A) Distribution of actin and MAP2 in a transfected hippocampal neuron in cell culture for 24 days, simultaneously expressing actin-GFP and MAP2c-YFP. The phase-contrast image (Left) shows the arrangement of the cell body and processes of the transfected cell interspersed with the network of axonal processes of untransfected cells. The original gray-scale images for actin-GFP (Center) and MAP2c-YFP (Right) images were prepared by using appropriate selective filter sets. (Bar = 20 μm.) (B) Comparative distribution of actin and MAP2 in a dendrite segment produced by overlaying pseudocolored images for actin-GFP (green) and MAP2c-YFP (red). The high concentration of actin in dendritic spines (arrowheads) contrasts with the confinement of MAP2 to dendrite shafts. (Bar = 2 μm.) (C and D) Time-dependent changes in the configuration of actin and MAP2 in dendrites. Six frames from a single time-lapse recording for actin-GFP (C) and MAP2-YFP (D) images, recorded alternately 30 s apart, were converted into profile outlines. Each outline was assigned a different color and overlaid onto a single gray-scale image from the same recorded sequence. Variations between the different color outlines indicate regions of morphological change that are evident in the actin images of dendritic spines (C) but are absent from the MAP2 images of the dendrite shaft (D). (Bar = 2 μm.) Refer to supplemental Movie 1 for the original time-lapse sequence.

