Figure 3.
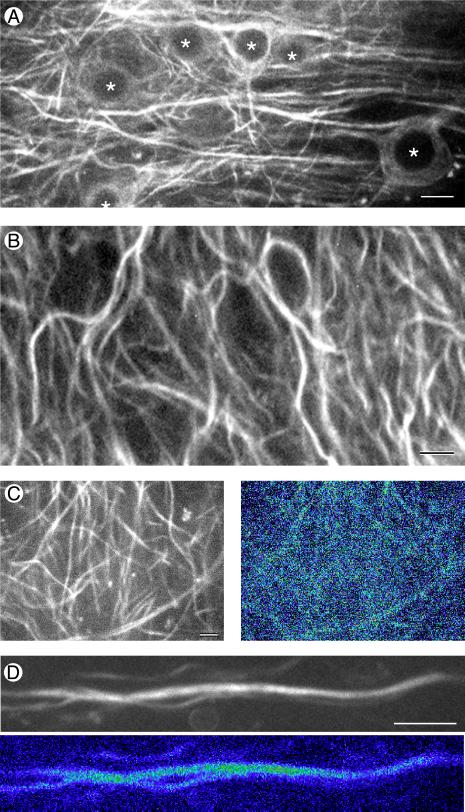
Time-lapse recording of MAP2 in hippocampal tissue slices from transgenic mice stably expressing MAP2c-GFP. (A) Confocal GFP fluorescence image taken near the cell body layer of area CA1 in an organotypic slice culture established from an 11-day-old transgenic mouse and maintained in culture for 25 days. Nuclei in cell bodies are marked with *. (Bar = 10 μm.) (B) MAP2 localization in hippocampal neurons is limited to the shafts of dendrites. Single frame taken from a time-lapse recording of MAP2c-GFP fluorescence in the CA1 neuropil of a hippocampal slice maintained in culture for 4 weeks. (Bar = 5 μm.) (C and D) Short-term time-lapse assay for MAP2 dynamics. (C Left) A single confocal gray-scale image of MAP2-GFP fluorescence in area CA1 of a 5-week-old hippocampal slice culture. (C Right) A pseudocolor “difference image” produced by summing gray-scale differences between images taken 30 sec apart over 10 min of time-lapse recording. Compare the overall lack of change in the MAP2 image (dark blue color) during the recording period to the high degree of change (green, yellow, and red) in actin images of similar configuration (Fig. 4A Right). (Bar = 5 μm.) (D) Long-term timelapse assay for MAP2 dynamics. Original gray-scale fluorescence image (Upper) and pseudocolor difference image (Lower) of a dendrite segment followed over a 3-h time period. The dark blue color again indicates an overall lack of change in MAP2 distribution during this longer recording period. (Bar = 5 μm.)

