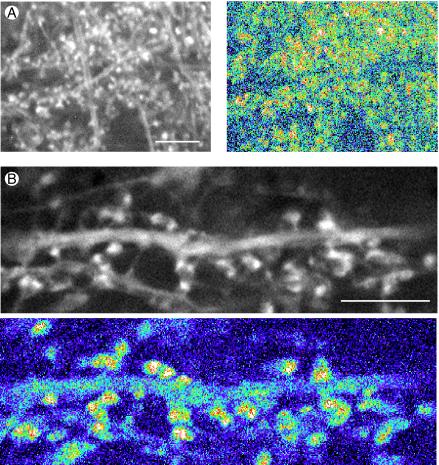
Figure 4.
Time-lapse recording of actin dynamics in dendrite spines of hippocampal tissue slices from transgenic mice expressing actin-GFP. (A) (Left) An original fluorescence image in a single frame from a time-lapse recording in which frames were collected 30 sec apart. (Right) Changes in actin distribution over 10 min displayed by difference imaging using a pseudocolor scale (see text for details). Red and yellow patches indicate areas of high motility associated with dendritic spines. (Bar = 10 μm.) (B) Single gray-scale frame (Upper) and pseudocolor difference image at higher magnification. Shape changes are associated with dendritic spines (red and yellow patches) whereas the dendrite shaft shows little dynamic activity (Lower). (Bar = 10 μm.)

