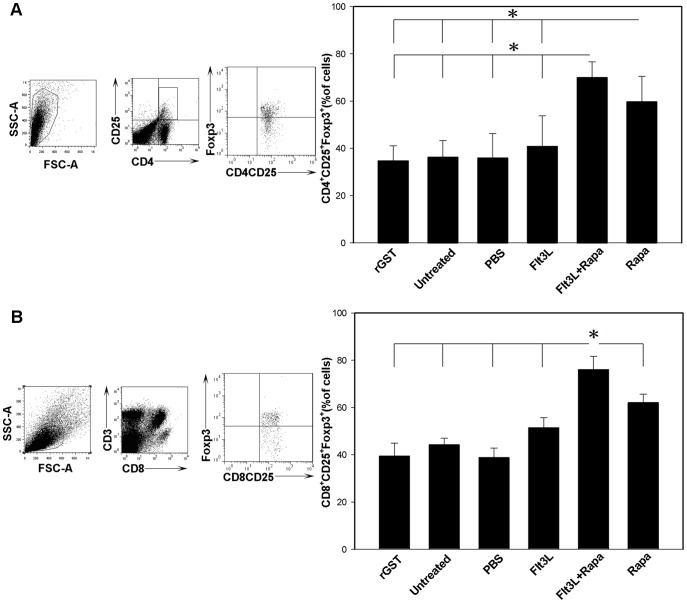
Figure 3. Flt3L combined with Rapa promotes the production of CD4+CD25+Foxp3+ and CD8+CD25+Foxp3+ T cells.
Spleen cells isolated from mice treated with Flt3L/Rapa and other control mice at the time of rejection or at study endpoint (POD 100) were analyzed to determine the proportion of CD4+ CD25+ Foxp3+ and CD8+ CD25+ Foxp3+ T cells. (A, B) The expression of Foxp3 by CD4+ CD25+ and CD8+ CD25+ T cells was analyzed by flow cytometry after intracellular staining. The bar graph was a summary of percentages of CD4+ CD25+ Foxp3+ T cells and CD8+ CD25+ Foxp3+ T cells in the recipients. The data shown are representative of three independent experiments that yielded comparable results (* P<0.05).

