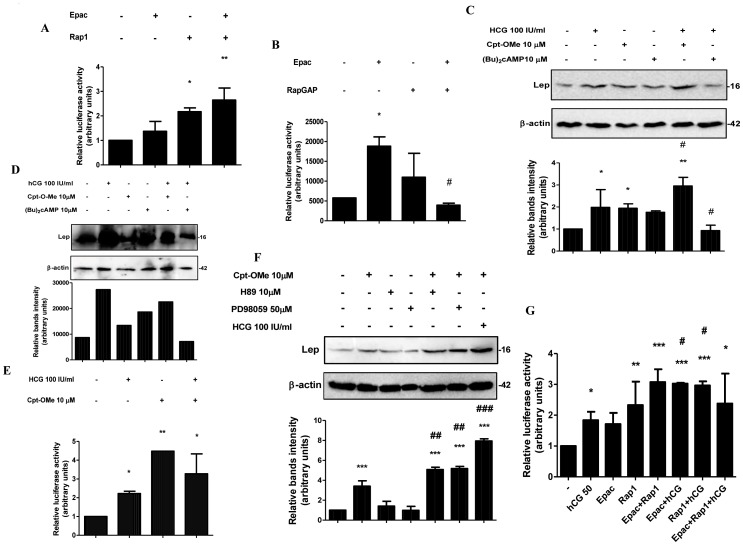
Figure 5. hCG induces leptin expression through the cAMP/Epac alternative signaling pathway.
(A) BeWo cells were transiently cotransfected with pL1951 and Epac (1 µg/ml) and/or Rap1b (1 µg/ml) proteins expression plasmids. (B) BeWo cells were transiently cotransfected with pL1951 Epac (1 µg/ml) and/or RapGAP (1 µg/ml) proteins expression plasmids. (C) and (E) BeWo cells (1×10⁶ cells) were plated in complete DMEM-F12 media supplemented with 1% FBS and incubated during 3 days with different doses of Cpt-OMe, hCG, (Bu)2cAMP, and H89, as indicated. Cell extracts were prepared as indicated in Materials and Methods. Proteins were separated on SDS-PAGE gels and leptin expression was determined by Western-blot. Molecular weights were estimated using standard protein markers. Loading controls were performed by immunoblotting the same membranes with anti-β-actin. Bands densitometry is shown in lower panels. Molecular weight (kDa) is indicated at the right of the blot. Representative results from three replicates are shown. (D) Cells were transfected with pL1951 plasmid construction and treated with hCG and/or Cpt-OMe, as indicated. (F) BeWo cells were cotransfected with pL1951 and/or Epac and Rap1b and treated with hCG (IU/ml). In (A), (B), (D) and (F) cells were incubated during 72 h in DMEM-F12 1% FBS media. Luciferase activity was measured in cellular extracts and normalized to β-galactosidase activity. Activity obtained with empty vector (PGL-3 basic vector) was set as a control. Results are expressed as mean ± S.E.M. for three independent experiments. *p<0.05, **p<0.01, ***p<0.001 vs. control; #p<0.05, ##p<0.01, ###p<0.001 vs. hCG treatment. (G) Placental explants were processed as previously described and treated with 100 IU/ml hCG and/or 10 µM Cpt-O-Me or 10 µM (Bu)2cAMP as indicated during 4 h. Proteins were separated on SDS-PAGE gels and leptin expression was determined by Western-blot. Molecular weights were estimated using standard protein markers. Loading controls were performed by immunoblotting the same membranes with anti-β-actin. Bands densitometry is shown in lower panels. Molecular weight (kDa) is indicated at the right of the blot.

