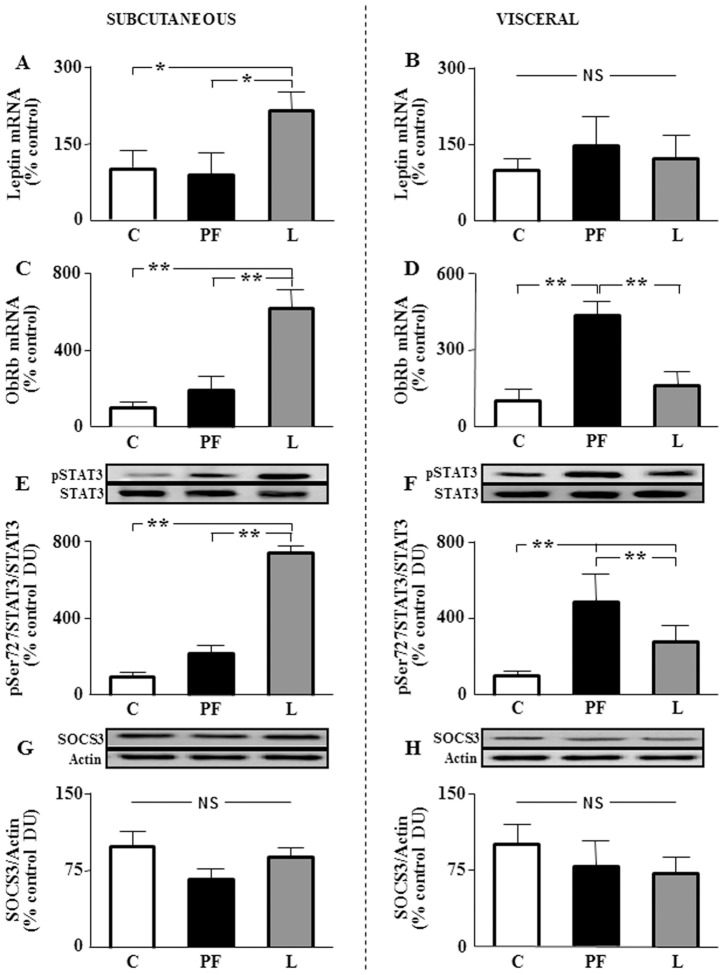
Figure 7. Leptin signaling in subcutaneous and visceral fat. A.
Relative mRNA levels of leptin in inguinal fat of rats that received saline (C) or chronic leptin (L) and the pair-fed group (PF). B. Relative mRNA levels of leptin in epididymal fat of the same groups. C. Relative mRNA levels of the long form of the leptin receptor (ObRb) in inguinal fat of the same groups. D. Relative mRNA levels of ObRb in epididymal fat of the same groups. E. Relative phosphorylated (p) signal transducer and activator of transcription factor 3 phosphorylated on serine 727 (pSer727-STAT3) protein levels in inguinal fat of the same groups. F. Relative pSer727-STAT3 protein levels in epididymal fat of the same groups. G. Relative suppressor of cytokine signaling 3 (SOCS3) protein levels in inguinal fat of the same groups. H. Relative SOCS3 protein levels in epididymal fat of the same groups. The data are expressed as a percentage of the control ratio. DU, densitometry units; NS, non-significant; *p<0.05 by ANOVA **p<0.01 by ANOVA.

