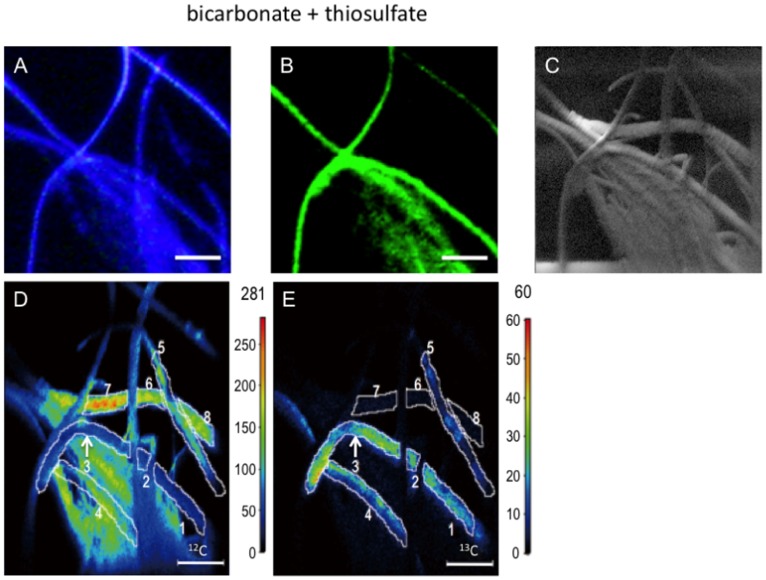
Figure 2. Analyses of epibiotic microbial cells after 13C bicarbonate tracer experiments.
Microscopic image of DAPI-stained epibiont cells in a specimen (A). Microscopic image of epibiont cells specifically bound to the EPI653 probe, which indicates that members of the genus Sulfurovum belonging to the class Epsilonproteobacteria were present in the same specimen (B). Scanning electron micrograph of epibiont cells in the same specimen (C). 12C-mapping image of epibiont cells in the same specimen performed using Nano-SIMS (D). 13C-mapping image of epibiont cells in the same specimen performed using Nano-SIMS (E). The values (secondary ion counts) corresponding to each of the colors are shown in the scale to the right of each map (D and E). The estimated 13C/12C ratios of the cells that are enclosed by the white lines are indicated in Table 3. The scale bar is 10 µm.

